The paper in 90 seconds
- Problem: Document queries differ in difficulty and evidence type. BM25 is cheap but can miss charts and semantic paraphrases. Multimodal late interaction can preserve page details, but it may impose a high latency cost on every ordinary query. A fixed pipeline applies the same cost and failure mode to all queries.
- Core insight: The paper turns “which retriever should we use?” into a prediction for each query. RetrievalRouter reads query text and selects one of five routes—BM25, text dense, text reranking, multimodal dense, or multimodal reranking. Its training target balances per-query nDCG@5 against normalized latency.
- Strongest evidence: Across 11 datasets from REAL-MM-RAG, T2-RAGBench, and MMDocRAG, totaling 85,103 queries, the authors report nDCG@5 of 0.755 and mean latency of 0.666 seconds at λ=0.1. The most accurate static multimodal late-interaction system scores 0.737 at 8.283 seconds (Section 6, Tables 1–2, Figure 2).
- Main boundary: These are offline benchmark measurements made on one NVIDIA H100 80GB GPU. The study does not establish the full cost of building, updating, and storing multiple indexes, serving concurrent traffic, changing hardware, or handling query-distribution shift.
This paper tackles a practical RAG tension: some questions need only lexical matching, others need semantic matching, and still others require reading tables, charts, or evidence spread across pages. Running the heaviest multimodal late-interaction pipeline for every query slows down easy cases. Using only a cheap text-vector route can lose visual evidence before retrieval begins. RetrievalRouter therefore adds a small query encoder that chooses a retrieval pipeline at query time. Its results show a better accuracy-latency position than fixed pipelines on the datasets and hardware it measured. The operational question remains whether offline query latency captures the real cost of maintaining and serving a multi-pipeline system.
This reading follows arXiv v1, submitted August 26, 2026; the authors and repository identify the work as an EMNLP 2026 main-conference paper. I separate the paper’s claims, what the experiments directly support, and Bloss0m’s engineering inferences.
Limits of prior approaches: a fixed route imposes the same cost on different queries
A common approach fixes one retriever at design time or escalates from a cheap route only when a query fails. These rules cannot express the case where two routes both find relevant documents but one produces a substantially better ranking for that particular query. They can also impose visual-processing costs on queries that do not need them. Late interaction preserves fine-grained evidence but adds inference and index cost; reranking narrows the candidate set, yet can still waste work or hurt ranking when a dense route is already sufficient. The gap addressed here is to learn a quality-efficiency choice for each query across heterogeneous retrieval pipelines over the same underlying corpus.
The retrieval design space: modality and architecture are separate axes
Retrieval systems make at least two intersecting choices. The first is modality. Text pipelines extract document text and index it; multimodal pipelines encode page images directly and can preserve layout, charts, and tables. The second is architecture. A dense retriever compresses a document or passage into a single vector for more efficient search. Late interaction retains multiple token or page-patch vectors, allowing fine-grained query matching at higher cost. Reranking first retrieves a candidate set with a faster model, then applies late interaction only to those candidates.
A single “retrieval quality” axis cannot describe this deployment choice. Text extraction can discard spatial layout. Dense compression can average away evidence from different parts of a document. Late interaction indexes more vectors and performs more comparisons. Multimodal is not a one-way upgrade either: page images can expose charts, while text pipelines can handle long textual details more effectively. Section 3 compares seven retrieval pipelines; five are available as routing actions, while two pure late-interaction pipelines remain static baselines.
| Short name | Route | Role and cost in this paper |
|---|---|---|
| BM25 | Lexical search over extracted text | Cheapest; useful for exact terms, but weaker on paraphrases and layout information not captured as text |
| TD | Text dense | Embeds extracted text into a single vector to find semantic matches; more expensive than BM25 |
| TL | Text late interaction | Retains token-level text detail; used as a slower static comparator, not a routing action |
| TR | Text dense followed by a late-interaction reranker | Retrieves 100 candidates first, then reranks them to recover fine-grained matching at lower cost |
| MD | Multimodal dense | Encodes a full page image into one representation; the faster multimodal route |
| ML | Multimodal late interaction | Retains page-patch details; one of the strongest static systems, but also the most expensive |
| MR | Multimodal dense followed by a late-interaction reranker | Retrieves visually, then reranks candidates; an important deployable static baseline |
In this setup, text pipelines also use a vision-language model to caption charts and tables, then append those descriptions to extracted text. The comparison is therefore not simply “text indexes never saw the chart.” The authors intend to compare the architectures within their specified pipelines. However, that captioner is also a text-pipeline preprocessing dependency. Teams using different OCR, captioning, chunking, vector databases, or index layouts may measure different quality and latency.
This design space complements BM25’s role in large-scale search and when complex chunking is worth adopting. The former shows that cheap lexical search remains useful; the latter highlights that representation and maintenance complexity have a cost. RetrievalRouter’s contribution is to formulate the selection among heterogeneous routes as one query-level decision, not to claim that one architecture makes the rest obsolete.
Core intuition: let the query determine which cost to pay
A fixed pipeline makes the same bet for every question. Choosing the cheapest one can fail on harder queries; choosing the most detailed one makes simple queries pay unnecessary latency. The router’s premise is that query text contains signals that can predict which capability is needed, even before the system scans documents. “Which row lists total assets?” may be answerable with lexical matching. “Which year does the blue bar represent?” requires visual information. A question that joins evidence from distant sections of a long report may benefit from a representation that preserves fine-grained matches.
These examples explain the qualitative cases in Figure 1; they do not mean that each query type can always be identified by stable keywords. The router does not inspect documents before deciding, and it does not run all five pipelines online to see which one wins. It learns a query-only policy from offline labels and selects one action at inference time. Whether that choice generalizes to new documents, languages, or serving loads depends on whether the training relationship between query form and route performance still holds.
A subtle point is that “fit” combines retrieval effectiveness and relative latency. Changing λ changes what the router is trained to optimize; it is not merely a runtime speed knob. The paper trains separate checkpoints for different λ values to trace a frontier. A deployed λ=0.1 model cannot be assumed to behave like a λ=0.7 policy simply by changing a parameter at inference time.
Walk one query through the method: from route candidates to one selection
Suppose a user asks, “In the annual report, which color marks overseas revenue in the bar chart?” This is an explanatory example, not a verbatim query from the paper’s evaluation.
- Measure all routes offline: For each training query, researchers run the five routing actions and record nDCG@5 and wall-clock latency. nDCG gives more weight to relevant documents nearer the top of the first five results. This multi-route measurement is part of dataset construction; it is not repeated for every online query.
- Turn quality and speed into a per-query reward: Each route receives . Here is route i’s nDCG@5 for query q, while is its latency divided by the sum of the five routes’ latencies for that same query. A smaller λ emphasizes ranking quality; a larger one emphasizes relative speed.
- Keep near-best alternatives visible: The reward vector is converted into a soft target using a softmax with temperature τ=0.1. If two routes have similar reward on this question, the training target retains the degree of preference instead of turning a tiny difference into a categorical winner.
- Learn the mapping from query representation to route distribution: Qwen3-0.6B-Base encodes the query, with LoRA adapters, and its final hidden states are mean-pooled into a 1,024-dimensional representation. A single linear head predicts scores for the five routes. Training minimizes the KL divergence from the soft target distribution.
- Choose one route online and return candidates: The policy receives the “bar-chart color” query and chooses BM25, TD, TR, MD, or MR, after which that route retrieves pages. If the visual cue resembles patterns in the training data, a multimodal route may be suitable. The router does not prove that the chosen route will succeed, and it does not check whether another route would return a better answer.
- Treat a retrieval failure as distinct from policy confidence: If the query needs long-range textual reasoning, or image rendering has lost the chart colors, the classifier can predict the modality while retrieval still fails because of index or model limitations. Router selection quality is not a substitute for checking relevance on each query.
The workflow separates two kinds of work. During data preparation, potentially expensive measurements across multiple retrieval routes create per-query supervision. At inference, a small policy avoids running every route for every query. The cost of measuring all routes on the training queries belongs to the supervision and evaluation process. It should not disappear from the engineering picture just because online policy overhead is 15 milliseconds.
The mechanism: five actions, soft targets, and the λ frontier
The authors compare seven retrieval pipelines, then leave pure TL and ML out of the router’s action set based on preliminary results. The reranking routes TR and MR achieve similar effectiveness at substantially lower latency than their pure late-interaction counterparts; adding near-redundant choices could make routing labels harder to learn. Thus “five routes” means BM25, TD, TR, MD, and MR. TL and ML remain in the static baselines and the Oracle’s larger action set. These sets should not be conflated.
For query q, a routing action has effectiveness and latency . The paper normalizes latency by the sum of the five selectable routes’ latencies for that query: . It then defines:
This normalized latency is a relative efficiency reward that permits route comparison within a query. It is not a direct dollar cost, nor is it an objective that includes service-level agreements, infrastructure charges, or index refresh. At λ=0 only nDCG matters; as λ approaches 1, faster routes gain preference. Training separate policies across λ values produces what the authors call the accuracy-latency frontier.
To avoid forcing ties or near-ties into a single hard label, the authors divide rewards by τ=0.1 and apply a softmax: . The low temperature amplifies small reward differences; exact ties remain ties. Queries with all-zero rewards are excluded from the gradient. When λ is greater than zero, even queries for which every route retrieves no relevant item can still provide a speed preference and therefore remain in training. The model fits the resulting distribution with a KL loss rather than directly predicting a relevant document.
The query encoder starts from frozen Qwen3-0.6B-Base weights, with LoRA adapters on attention and feed-forward projections. The query alone becomes a pooled 1,024-dimensional representation, followed by a linear decision head. At inference the system takes . This is a single-action selection policy, not a cascade or an ensemble of retrieval results. The per-query Oracle must be kept distinct from the deployable router: the Oracle can inspect the actual reward of each route for a test query before selecting the best one. It is an upper-bound reference, not a query-only policy with the same information available at inference.
There is also an operational distinction in where λ appears. It changes the training reward and helps trace the policy frontier. Once a checkpoint is deployed, the online query does not cause the system to adjust its quality-speed preference dynamically. To switch from a low-latency mode to a quality-oriented mode, the evaluated approach uses another trained checkpoint and calls for revalidation under the new workload; it does not establish that modifying λ on an existing policy will work.
How to read the experiment: what the 11-dataset result compares
The evaluation covers FinReport and FinSlides from REAL-MM-RAG; FinQA, ConvFinQA, VQAonBD, and TAT-DQA from T2-RAGBench; and ArxivQA, Wiki-SS, MP-DocVQA, SciQAG, and DUDE from MMDocRAG. Together these are 11 datasets and 85,103 queries, spanning financial documents, scientific papers, open-domain material, and chart-heavy presentations. All retrieval pipelines, router training, and inference run on the same NVIDIA H100 80GB GPU. This makes timing comparisons more controlled within the experiment; it does not predict relative speed when models run on different hardware, with different batching, caching, or index layouts.
The main metrics are nDCG@5, MRR@5, Recall@5, and per-query mean and P95 latency. Latency includes router inference, embedding generation, and vector search. The authors test normality of paired differences, then use a paired t-test or a two-sided Wilcoxon signed-rank test, applying Holm correction across planned comparisons and reporting significance at . The storage analysis reports disk footprint for four neural vector indexes. In the combined corpus, the multimodal late-interaction index is about 39 GB versus about 3 GB for the text-dense index—more than 13 times larger—while the BM25 lexical index is excluded from the vector table (Limitations; Table 3). This shows how query-latency gains can trade for persistent storage; the table still does not establish total indexing and operating cost.
| Evaluation question | Reported observation | Boundary of the interpretation |
|---|---|---|
| Does a static pipeline combine quality and speed? | ML has the highest nDCG@5 at 0.737 but takes 8.283 s on average; MR gets 0.733 at 1.121 s; MD gets 0.666 at 0.385 s; BM25 gets 0.510 at 0.019 s (Table 1) | This is a trade-off in this benchmark, not a universal ranking for enterprise corpora |
| Does the router improve on static neural pipelines? | At λ=0.1 it reports 0.755 and 0.666 s; at λ=0.5, 0.707 and 0.314 s; at λ=1, 0.510 and 0.034 s (Table 2) | The first two points show measured combinations; λ=1 selects BM25 for every query but still adds about 15 ms of policy overhead |
| Does it beat the closest adaptive baseline? | From λ=0 through 0.5, router nDCG is significantly higher but the baseline is faster. At λ=0.7 the router reports 0.630/0.148 s versus 0.624/0.171 s for the baseline, with neither difference significant (Section 6) | The router does not significantly lead at every point. Higher effectiveness at quality-oriented settings comes with more latency |
| How much routing headroom remains? | A per-query Oracle over seven pipelines reports 0.901 at λ=0.1 (Table 2), far above the router’s 0.755 | The Oracle uses each test query’s measured route rewards, so it is not deployable. The gap is both possible headroom and evidence that the query-only model still makes imperfect choices |
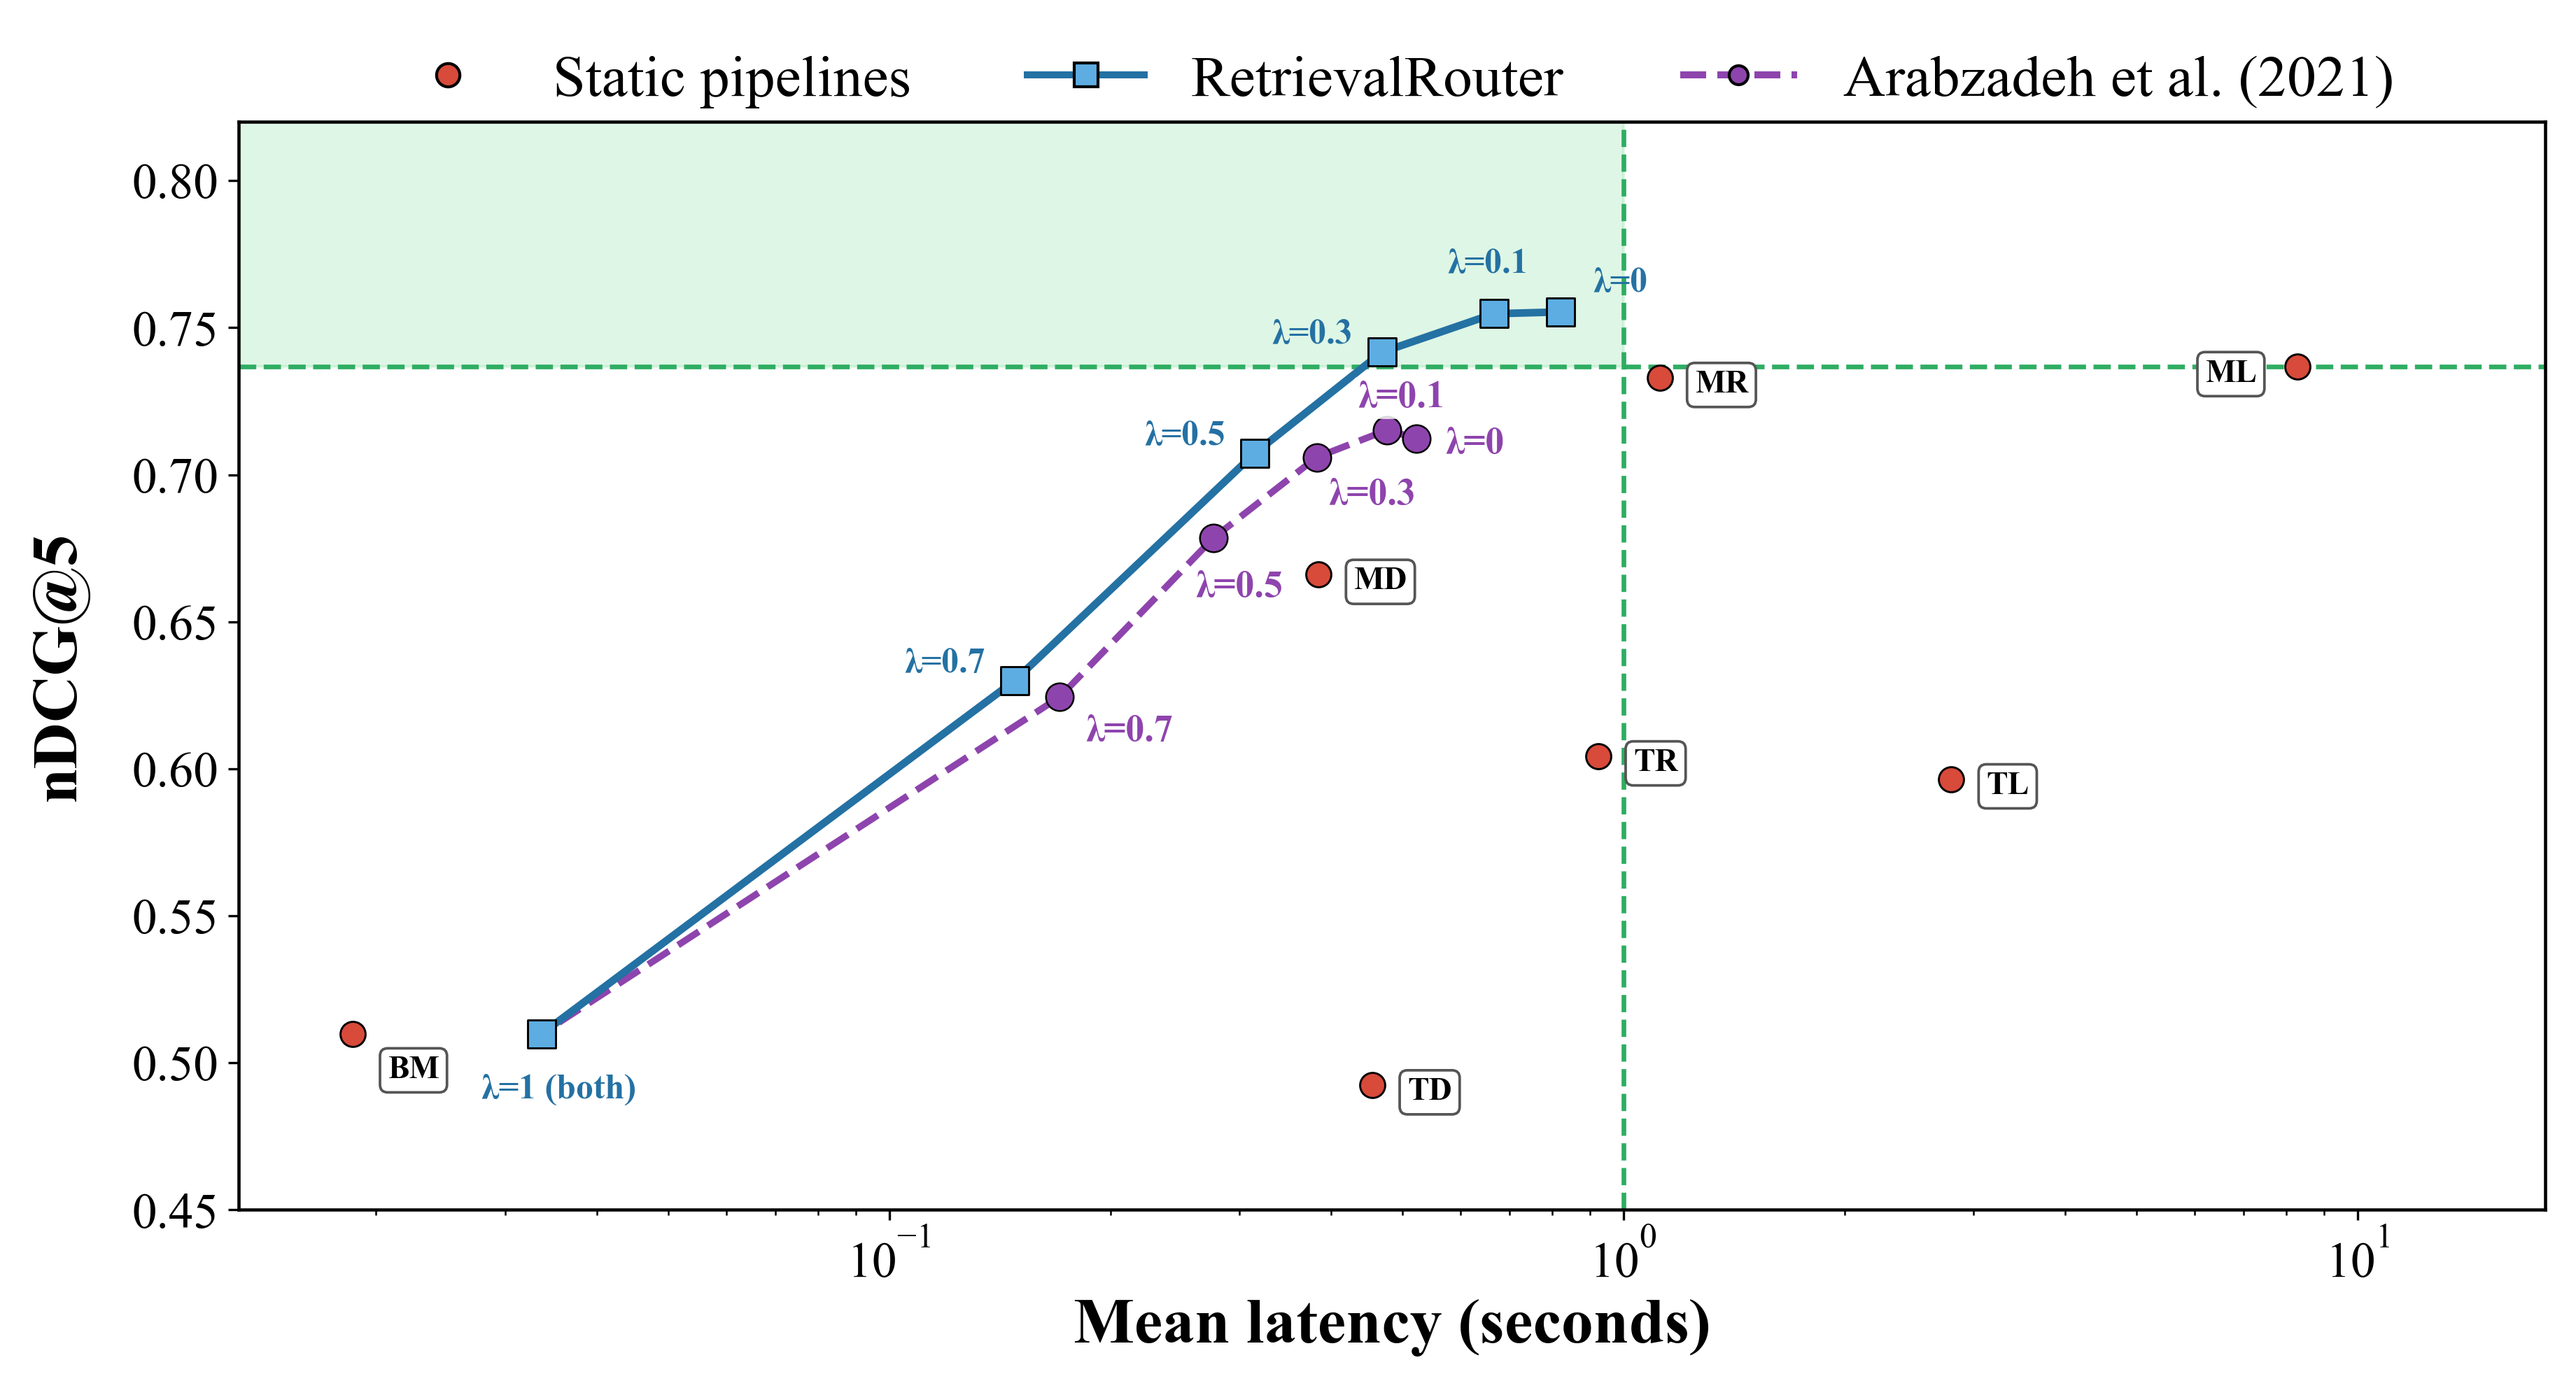 Figure 2 (Section 6): Compares static systems, RetrievalRouter points for different λ values, the adaptive baseline, and the Oracle by nDCG@5 and mean latency. The key is that the router offers multiple frontier points; the Oracle is not a deployable result. Source: paper Figure 2 and original image. The paper is licensed under CC BY 4.0; reused unchanged with attribution.

Read the reported 2.5% improvement with its comparator in view: the authors compare the router’s 0.755 at λ=0.1 with 0.737 from static ML, the most accurate static pipeline. Latency is 0.666 versus 8.283 seconds, or about 12.4 times faster. This is not a comparison with the cheapest BM25, and it is not a 12.4-fold reduction in total cost. The router changes measured effectiveness and mean query latency at its operating points, but those means do not account for index construction, updates, warm-up, storage, data synchronization, or persistent serving capacity.
The route distribution gives a view into what the policy learned. Figure 3 shows how query allocation changes as λ moves from quality to efficiency. The adapted Arabzadeh baseline assigns a hard label: the cheapest pipeline that ranks a relevant page first. It therefore favors MD, a cheaper neural route that succeeds on many queries, even at the quality-focused end; it cannot represent the additional ranking improvement from a more expensive route. RetrievalRouter’s soft targets can encode quality and latency differences together. The authors also report that, at λ=0, the router sends 20% of Wiki-SS queries to BM25 because it beats four of six neural static pipelines on those queries; the baseline does not select BM25 at that point. This is evidence about that dataset, not proof that a query-only policy will find lexical wins in every domain.
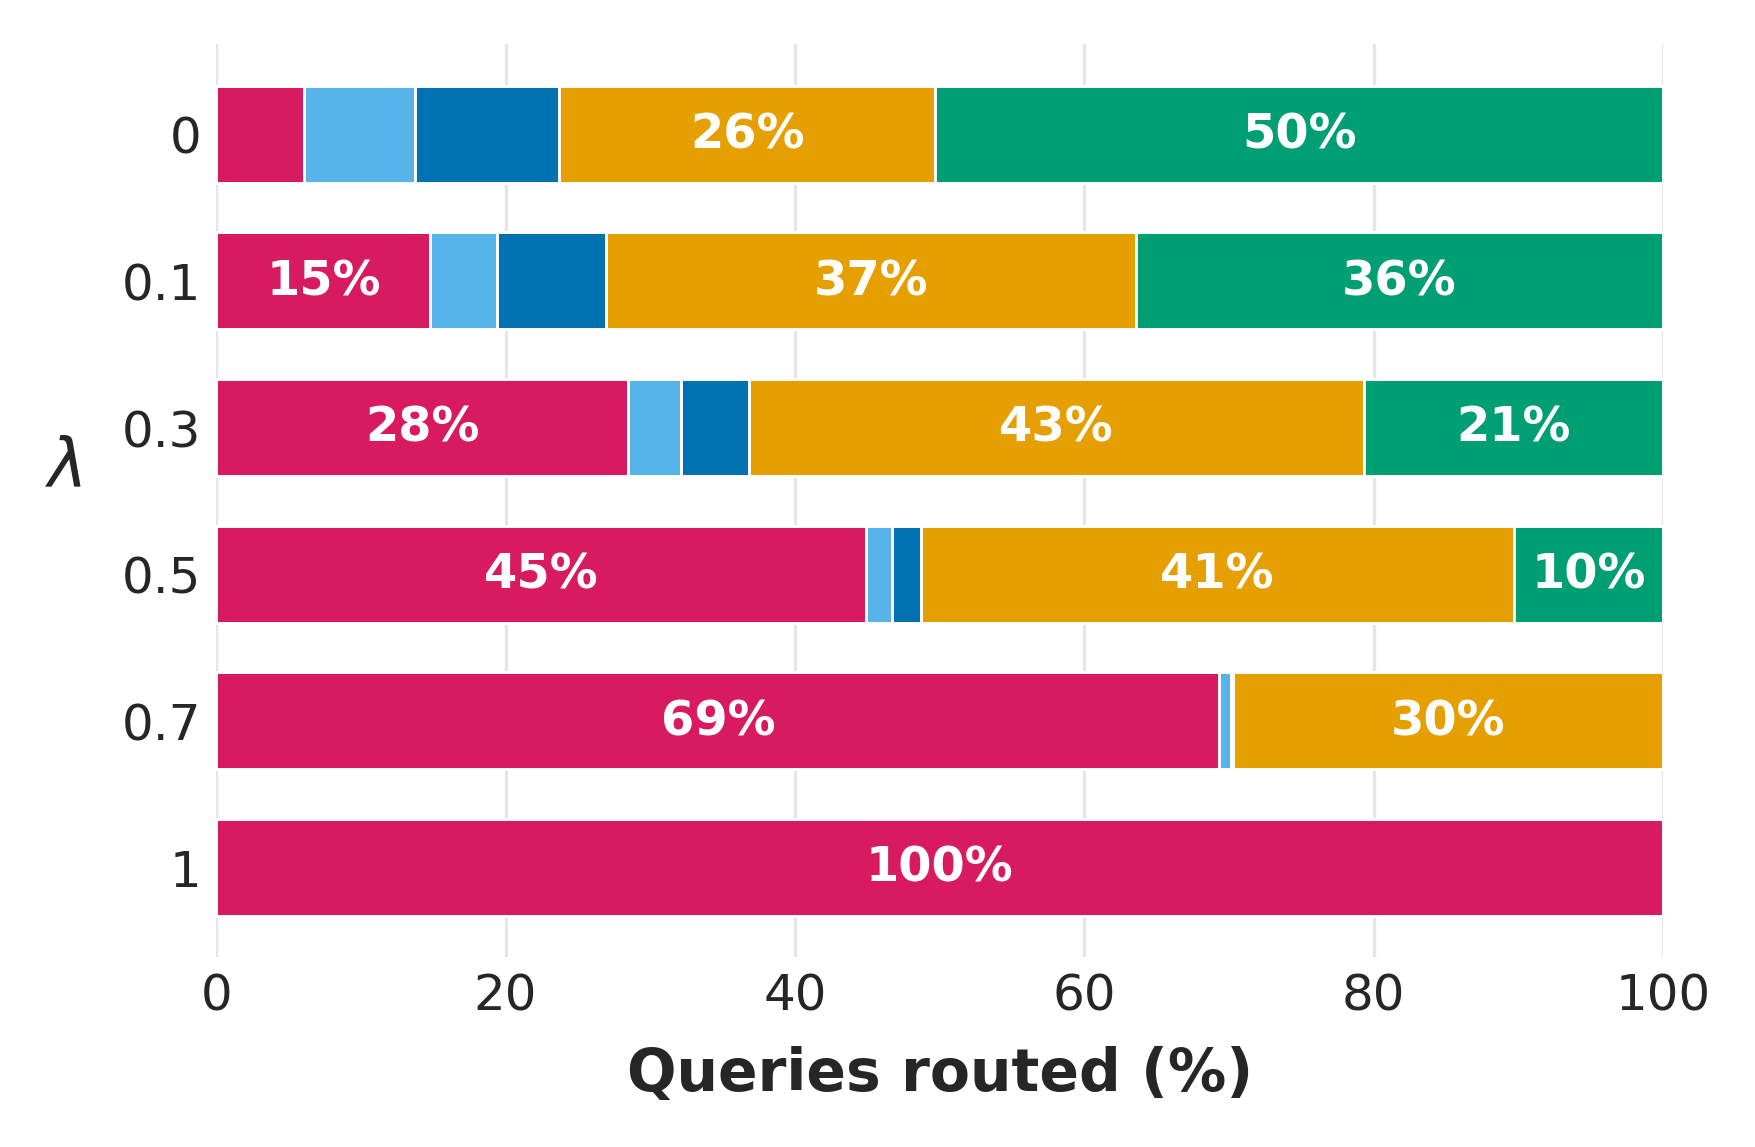
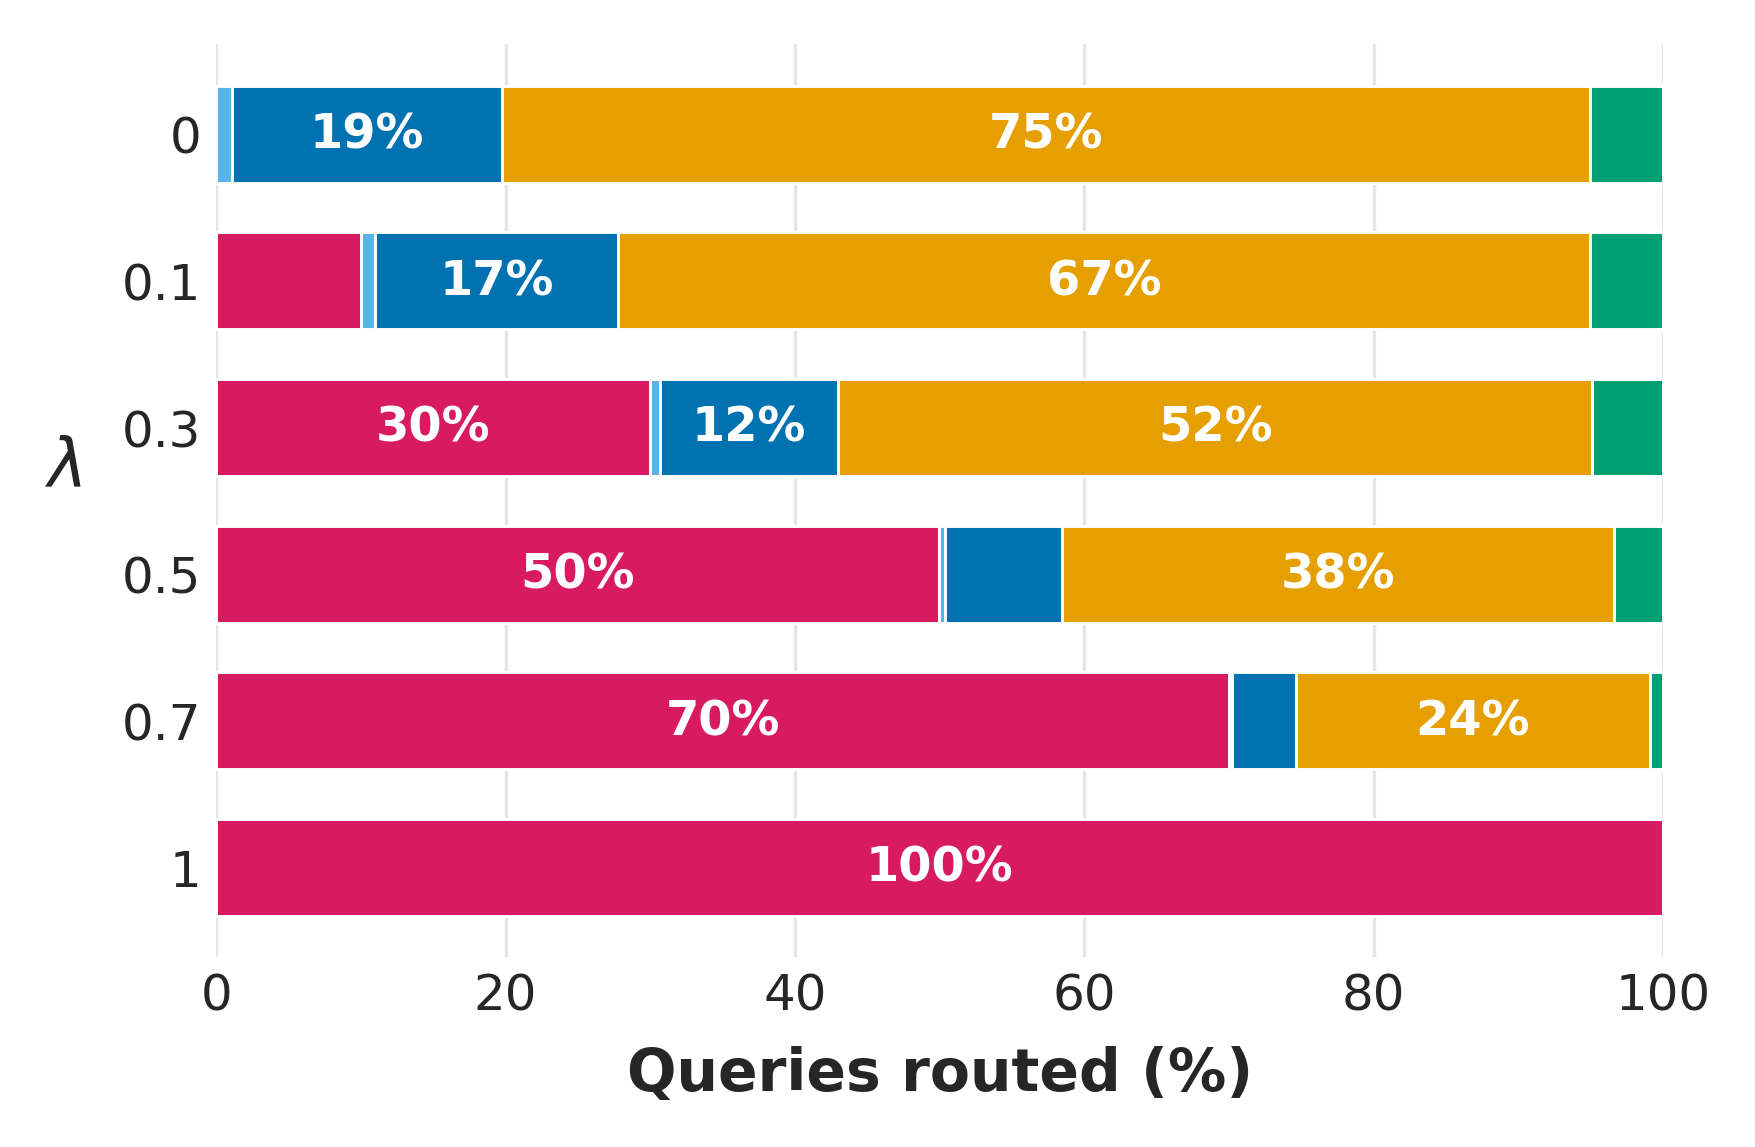 Figure 3 (Section 6.1): The top panel shows RetrievalRouter and the bottom panel the adapted strategy-selection baseline, allocating queries across actions at different λ values. It complements Figure 2 by showing how the frontier changes with action allocation; it does not measure online traffic. Source: paper Figure 3. The paper is licensed under CC BY 4.0; both original raster panels are reused unchanged with attribution.
Figure 4 compares router and Oracle decision quality. Rows group queries by the selected route; columns show each route’s reward on the same set of queries. Both have a strong diagonal pattern: for queries assigned to a route, that route is near the better rewards. This gives more support for discriminative selection than aggregate nDCG alone. But the heatmap averages within selected-route groups; it does not show that every query was routed correctly. The Oracle selects TL 213 times and ML 39 times, compared with 882 selections of TR and 1,068 of MR. In this dataset and at this λ, reranking captures most queries that benefit from fine-grained interaction, though a small subset still favors pure late interaction.
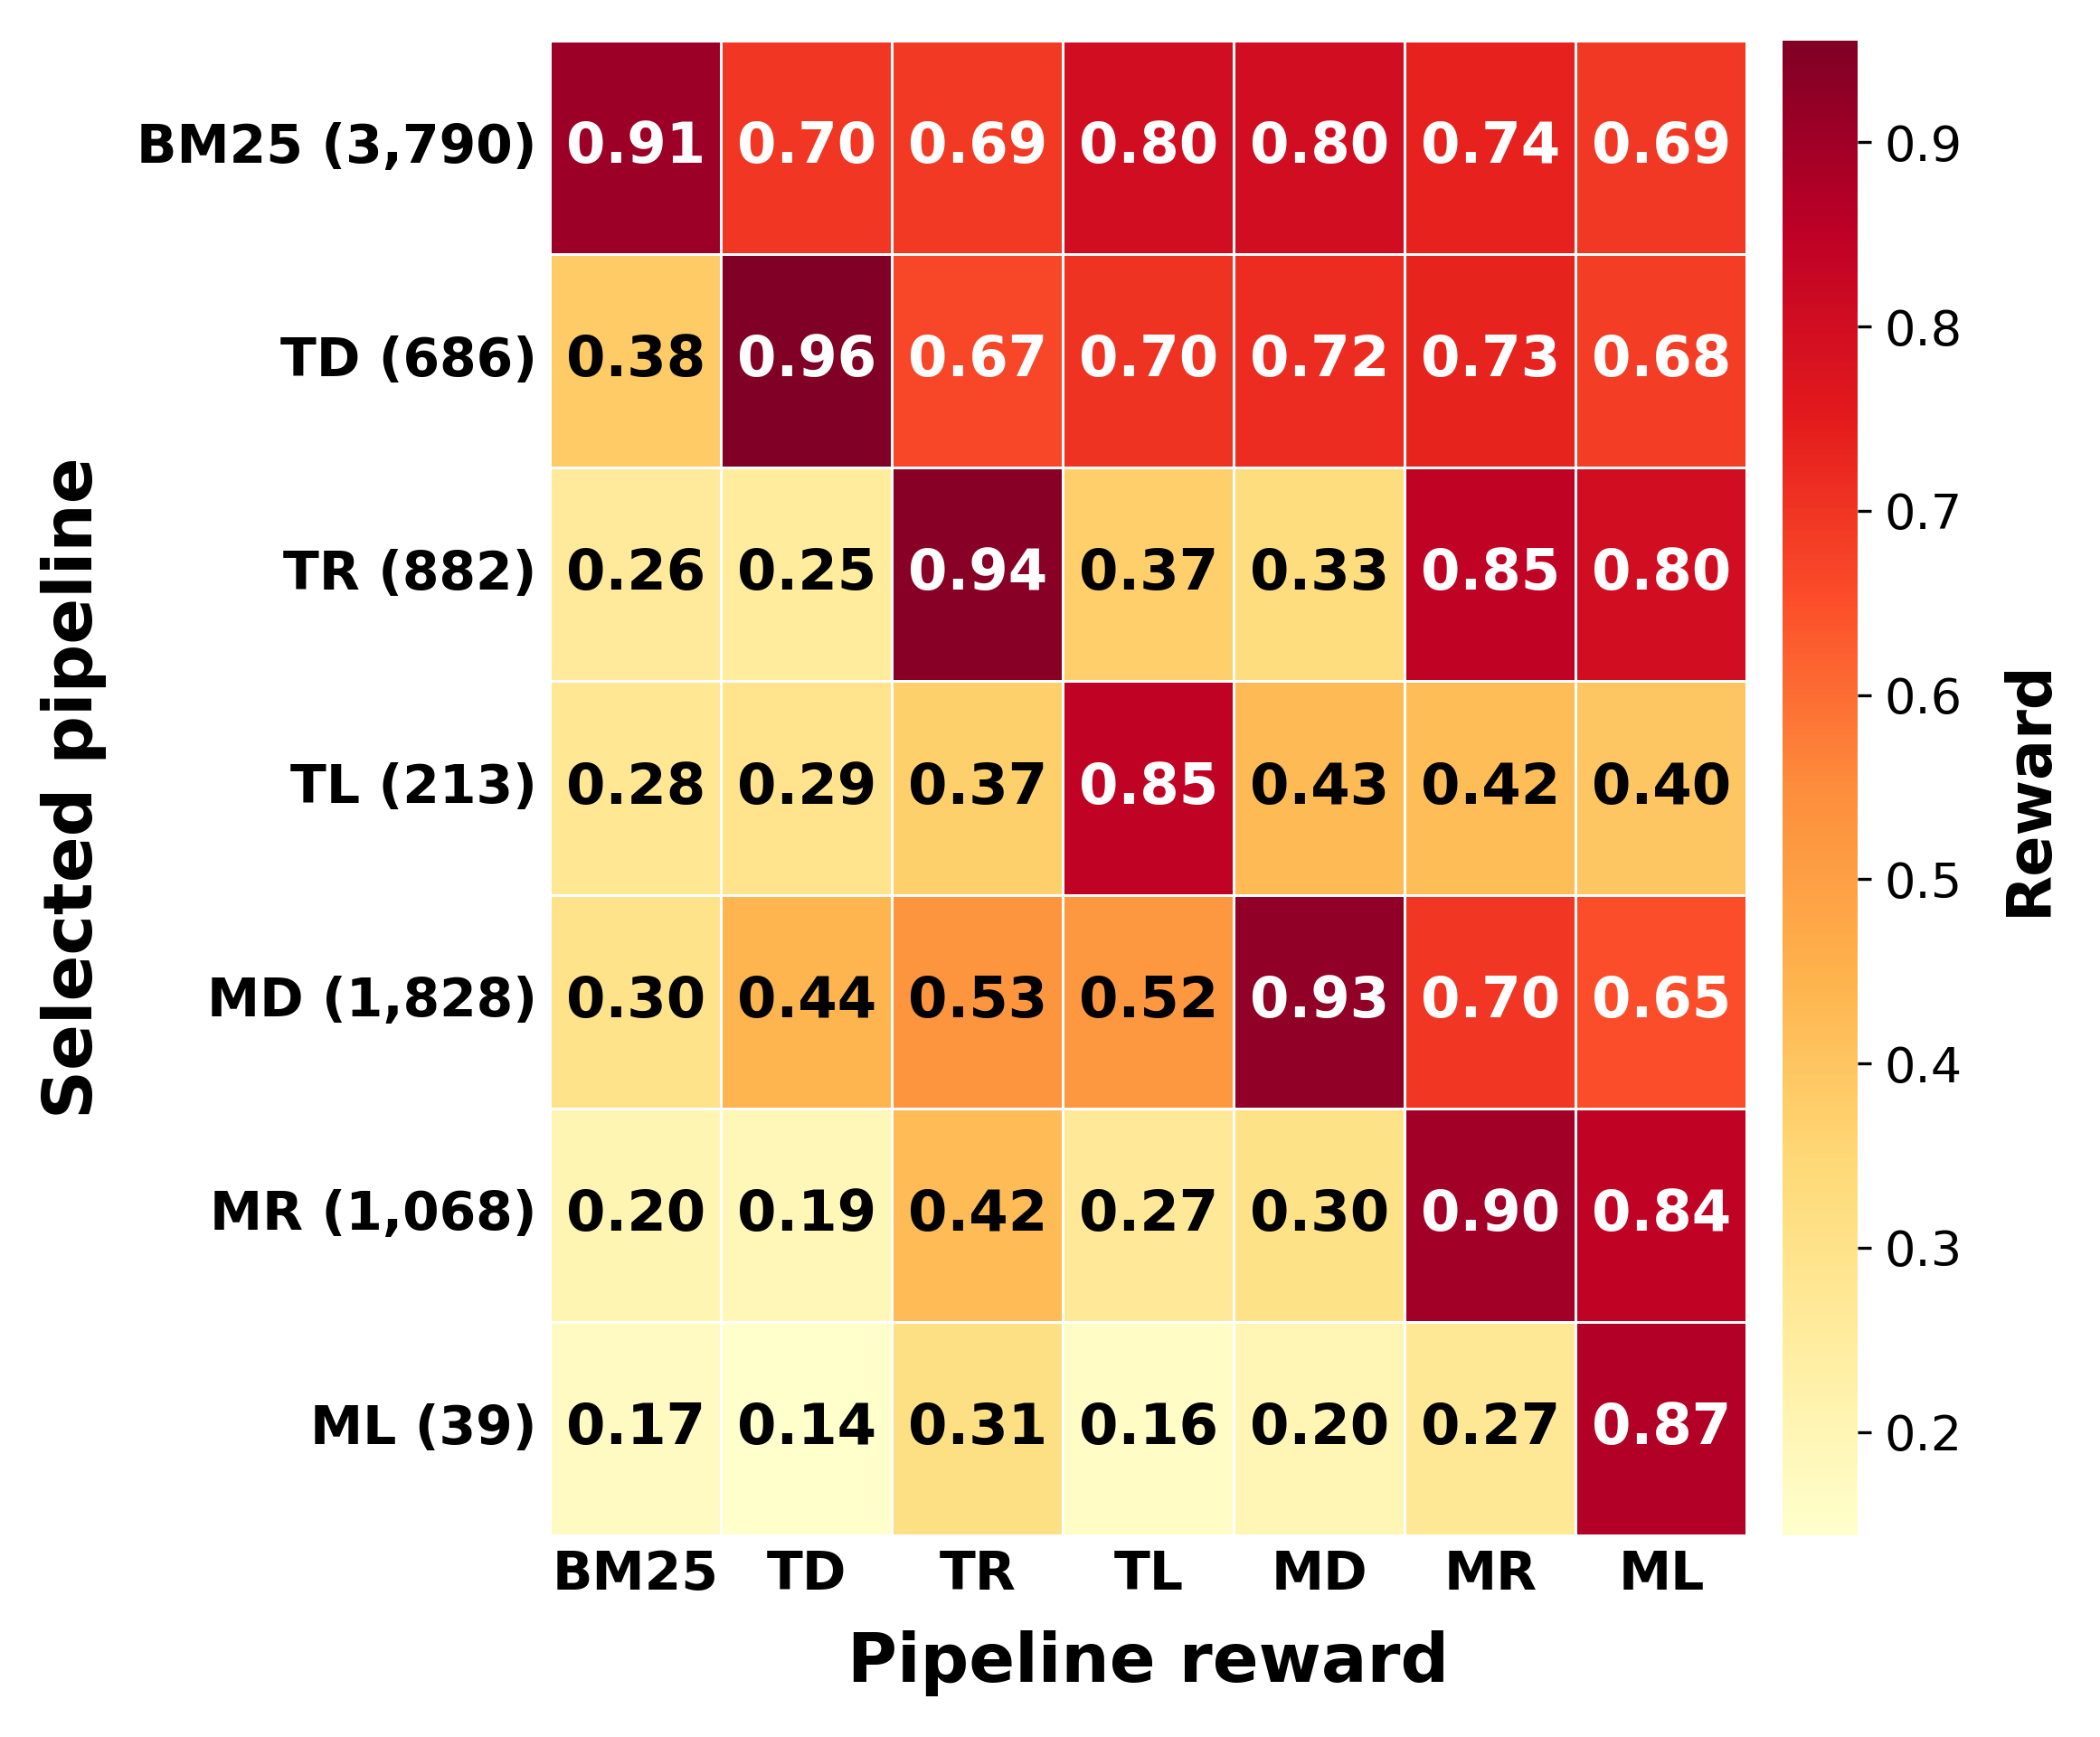
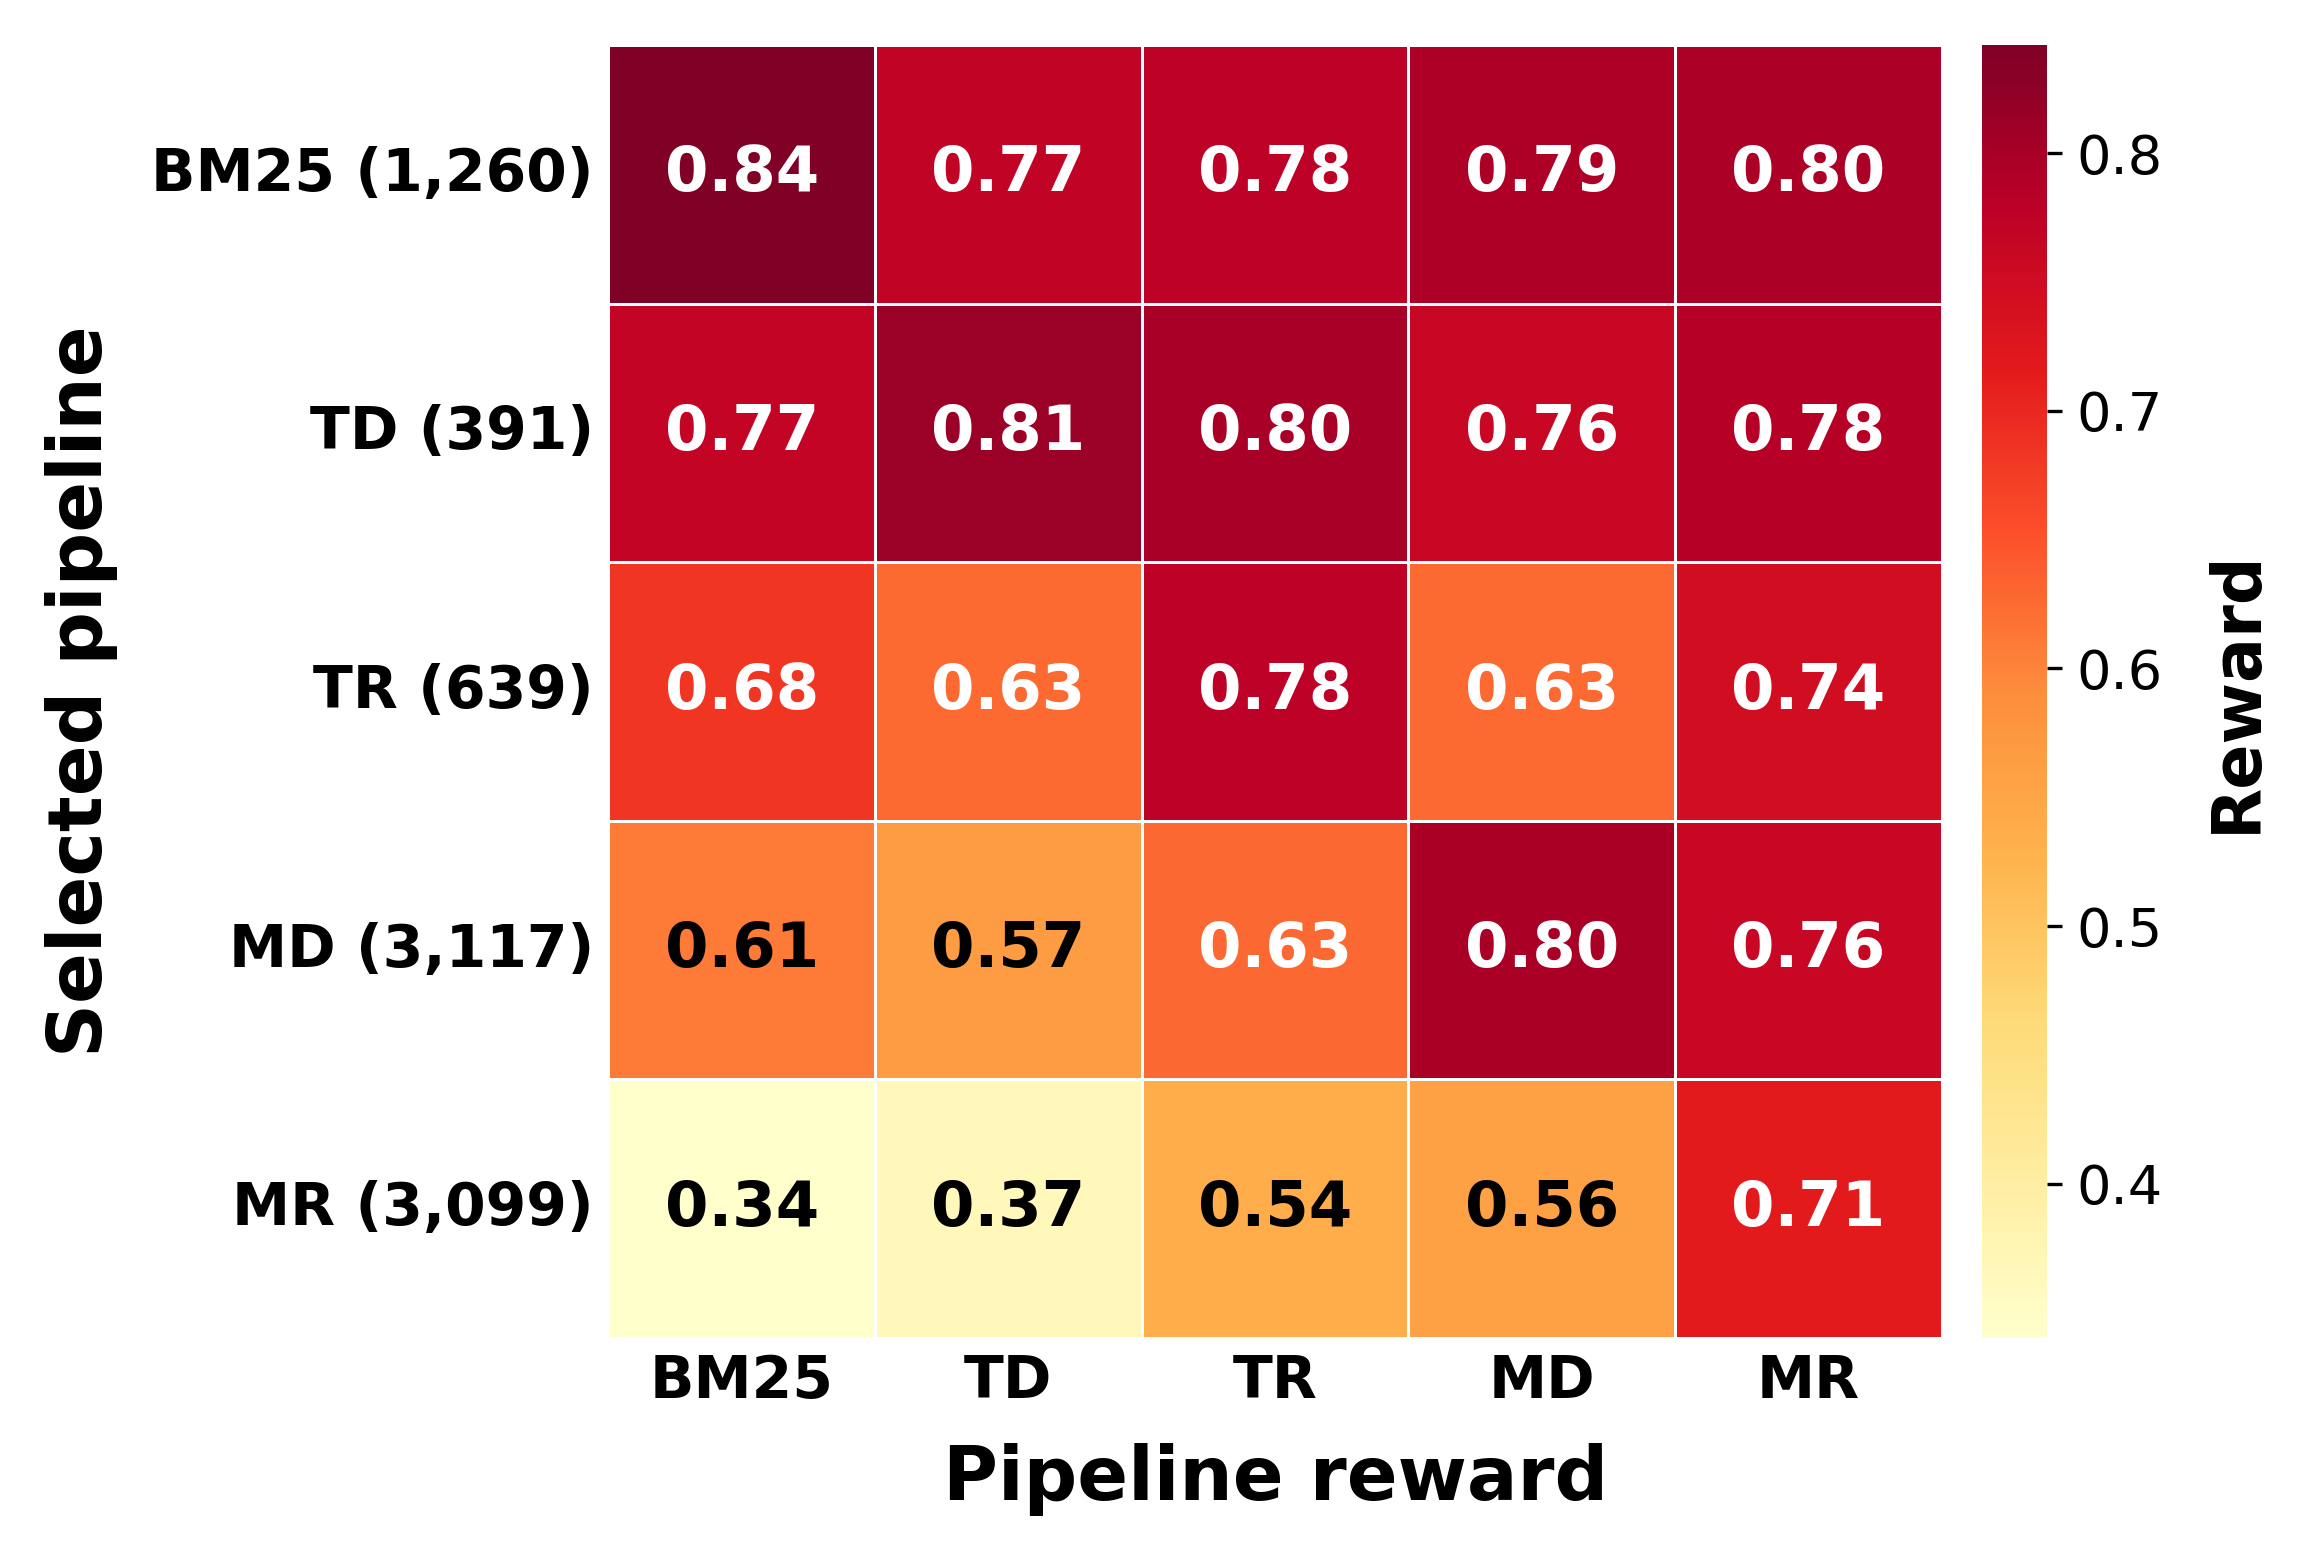 Figure 4 (Section 6.2): The top panel is the Oracle and the bottom panel the router; rows group queries by selected route and columns show each route’s reward on those same queries. Diagonal concentration means high average reward within a group, not perfect query-level routing. Source: paper Figure 4. CC BY 4.0; both original panels are reused with author and source attribution.
Failure patterns and boundary evidence: what average scores conceal
The authors define visual density as the fraction of each page occupied by non-text elements and estimate it with DocLayout-YOLO. Figure 5 groups results by density. BM25 nDCG@5 falls from 0.593 in the lowest-density group to 0.292 in the highest; TD and TL also decline as visual density rises, while multimodal routes remain more stable. This fits the proposed mechanism: text extraction linearizes layouts and loses spatial relationships in tables and charts. But density is not randomized. Datasets and queries may differ in other ways at the same time, so this supports an association and a diagnostic explanation, not a causal estimate of the exact drop due to images alone.
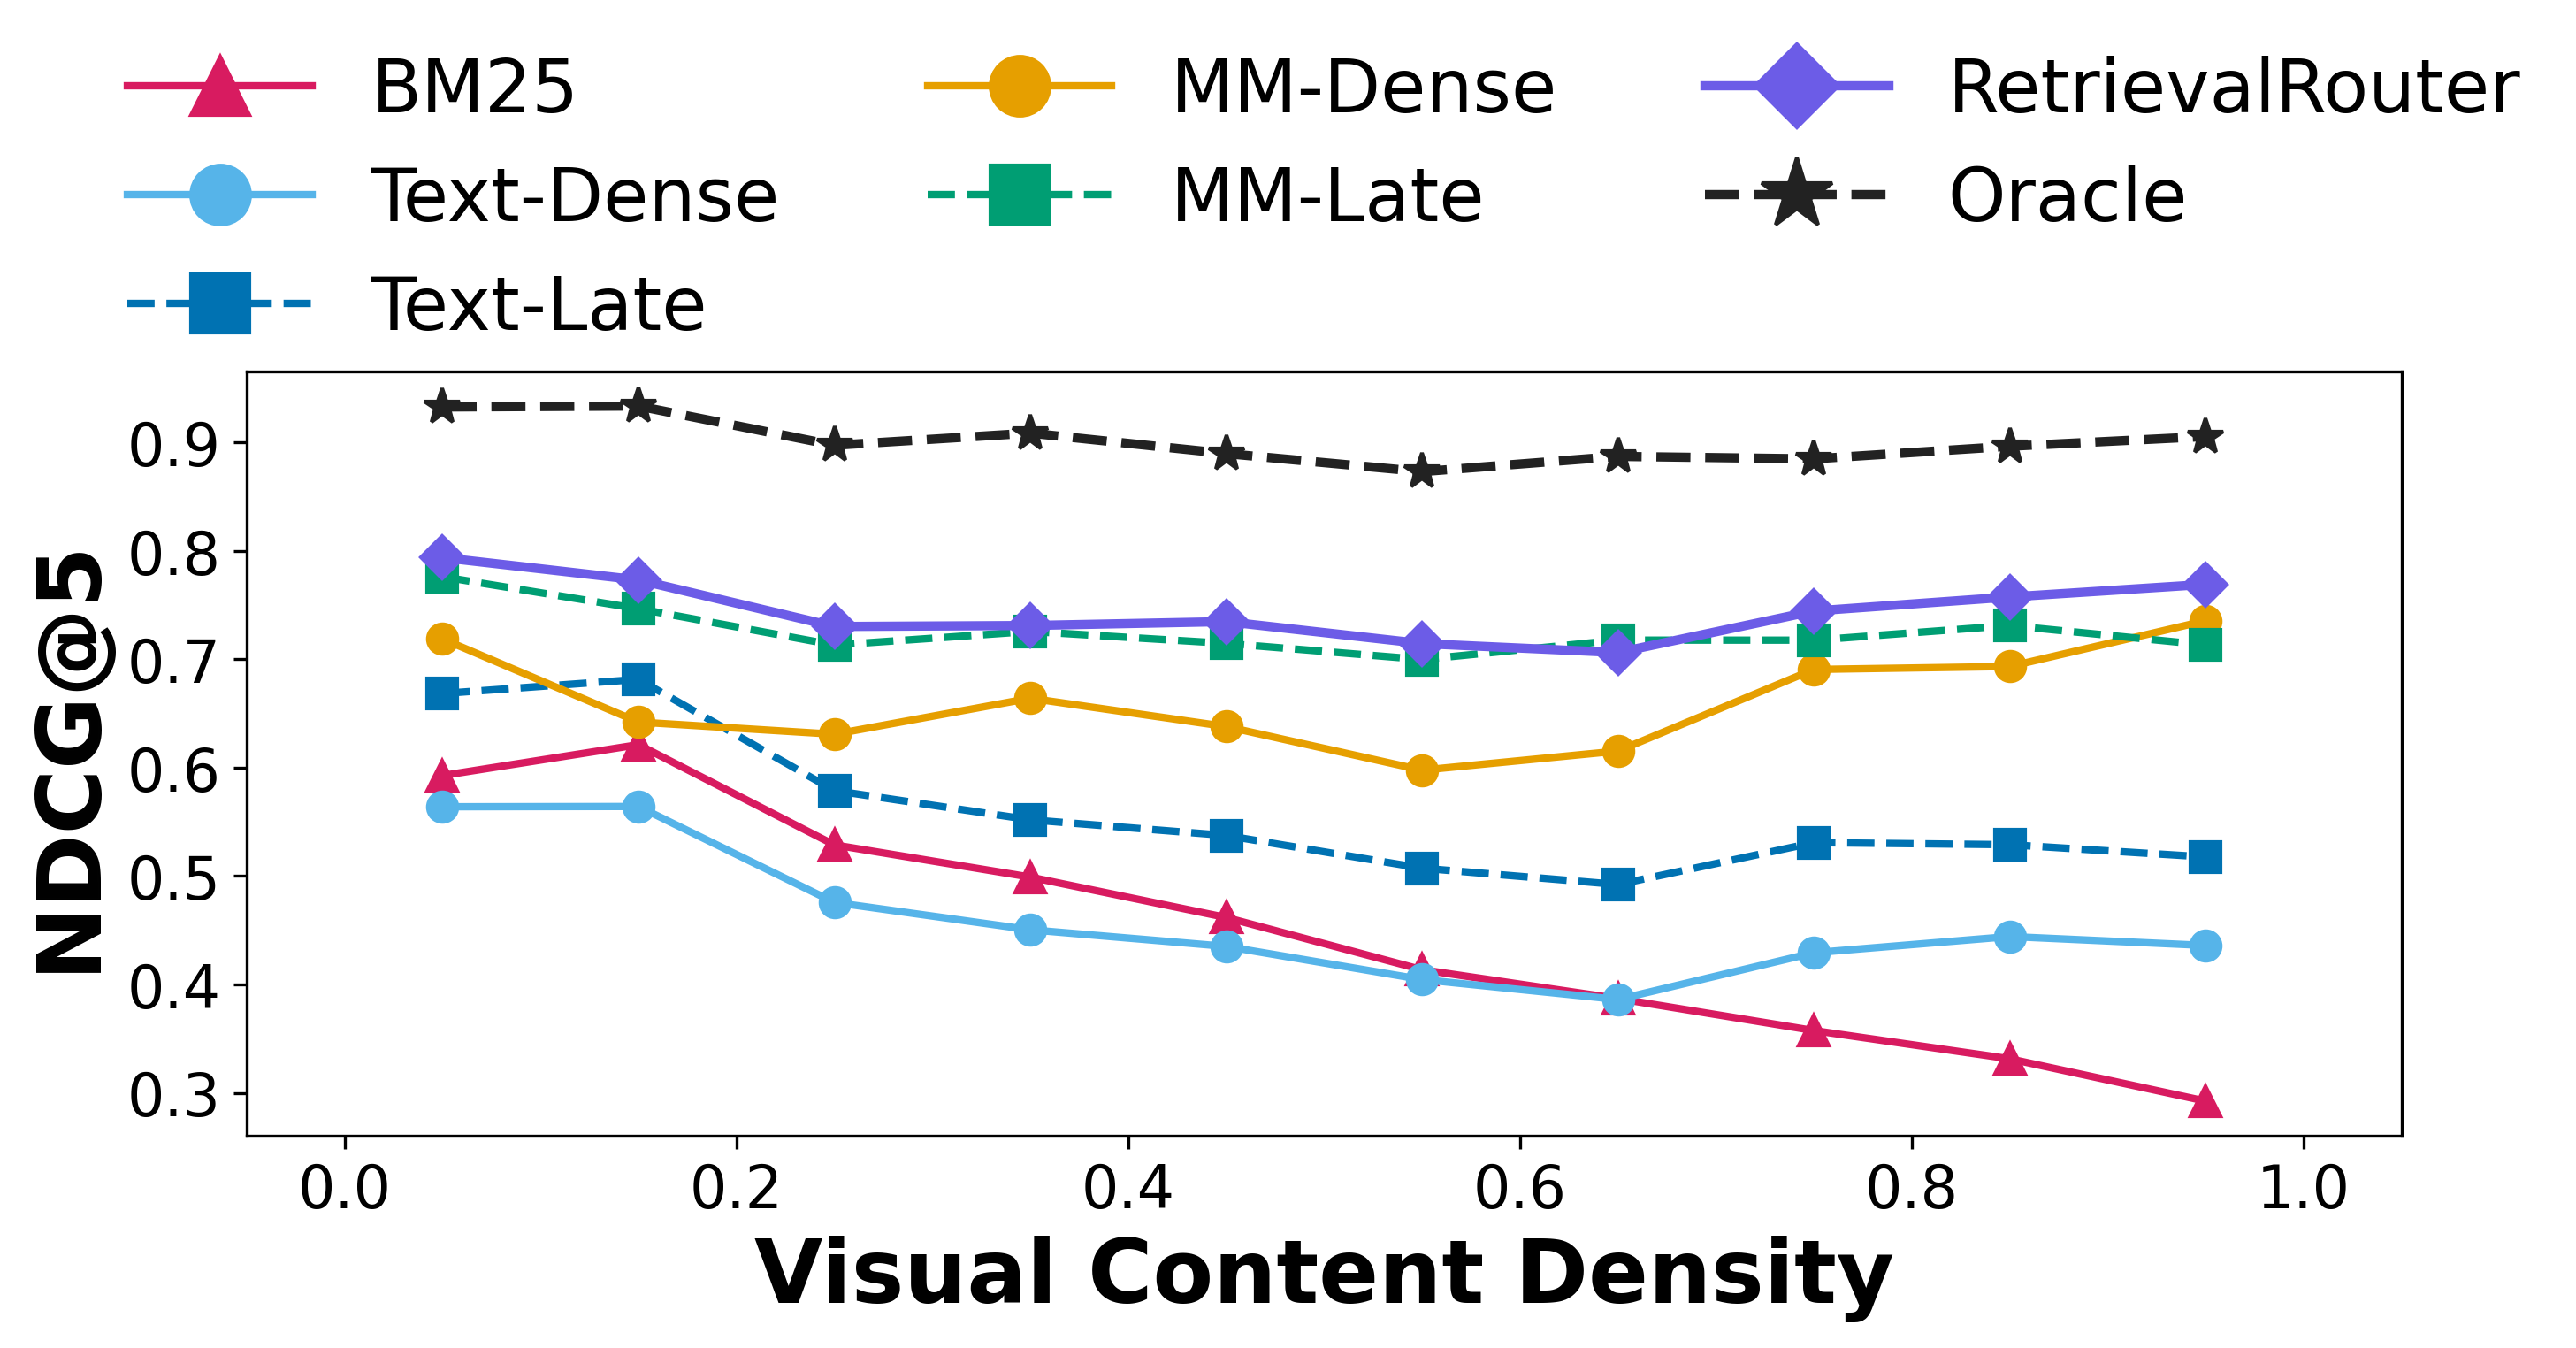 Figure 5 (Section 6.3): Groups nDCG@5 by page visual density, showing greater sensitivity in text routes and relative stability in multimodal routes. This grouped result is not a randomized causal estimate. Source: paper Figure 5. CC BY 4.0; reused unchanged with attribution.
Another counterintuitive result is that a more complex route is not always better. On the 1,828 queries where the Oracle chooses MD, MD’s average reward is 0.93. Replacing it with multimodal reranking MR on those same queries lowers average reward to 0.70. Reranking is not useless; on some queries it adds cost and can even worsen ranking. Conversely, MD’s aggregate nDCG is much lower than its late-interaction counterparts, yet it is the best route for a particular subset. This is why fixed-pipeline and query-level comparisons can lead to different engineering decisions.
The paper reports per-query nDCG, MRR, and Recall, alongside mean and P95 latency. This goes beyond a headline nDCG. Still, it does not evaluate online A/B behavior, concurrent serving, queueing, tail latency under load, cache hits, or index refresh. P95 latency under the experiment’s conditions is not a high-concurrency service SLO. Router inference adds 15 ms. When every query goes to BM25, total latency increases from 0.019 to 0.034 seconds, making the policy overhead relatively visible on the cheapest route.
Limitations and validity threats: an offline frontier is not online cost
Data and training variance: The data cover English-language financial, scientific, and open-domain corpora. The authors advise evaluating on representative queries when deploying outside those distributions (Bias and Generalization). Each lambda checkpoint is trained once with seed 42, with no across-initialization variance estimate (Appendix A). Paired significance tests in Table 2 compare systems on the same held-out queries; they do not account for training randomness or external validity on new corpora.
Hardware and full cost: Results are measured on one H100 80GB. Although the paper measures query latency and discusses policy overhead, deployment requires four neural vector indexes and a separate BM25 index. The Limitations section and Table 3 report about 39 GB for the combined multimodal-late index versus about 3 GB for text-dense, a ratio greater than 13 to 1. This does not yet model data refresh, index construction time, index consistency, throughput on other hardware, or serving capacity as a complete total-cost calculation.
Online transfer and decision boundary: The study does not measure concurrency, queueing, cache behavior, index updates, or query drift under online load. Query wording, document layout, and relevant-page distributions may change on a new corpus. A text-only router does not see the documents and does not detect that a retrieval result omitted necessary evidence. The paper advises in-domain evaluation beyond its English training distributions; this should be treated as a prerequisite to adoption, not optional follow-up tuning.
Multimodal retrieval also has a clear weakness on text-intensive queries. On Wiki-SS, text late interaction TL reaches nDCG@5 of 0.784, above ML at 0.743 and MR at 0.732; BM25 reaches 0.745 (Table 5). At λ=0, the router sends 94% of queries to text routes, including 20% to BM25 (Appendix B). This is a reminder that a multimodal document does not mean every query needs visual retrieval.
Evidence map: author claims, measured support, and open questions
Paper claim: A query-only router can select among five heterogeneous retrieval actions and provide accuracy-latency operating points better than fixed neural pipelines, while improving quality-oriented settings over an adaptive strategy-selection baseline.
Direct experimental support: The authors collect per-query results from five routes across 11 benchmark datasets and 85,103 queries; final prediction comparisons use 8,506 unique test queries. Tables 1–2 and Figures 2–5 report static pipelines, the policy frontier, route allocation, per-route reward groups, and sensitivity to visual density. Each λ setting is trained once with seed 42, with no across-seed variance reported (Appendix A). Paired tests support significance for particular comparisons but do not remove limits from the single training run, benchmark choice, hardware, or external validity.
Bloss0m interpretation: The useful contribution is not that “multimodal retrieval is always faster.” It is a measurable policy framing: which quality-cost combination fits each query? If a product’s queries and documents are well served by one fixed route, the router may add needless dependencies. If route failure patterns differ across queries, it may be worth rebuilding the frontier on local data and testing it with live traffic.
| Conclusion supported by the paper | Conclusion that does not follow directly |
|---|---|
| On the authors’ H100 benchmark and candidate routes, the router offers several useful frontier points | Any corpus, hardware, or vector database will gain accuracy and reduce total cost at once |
| Per-query reward varies across routes, supporting query-conditioned selection in this setting | Query text captures every relevant modality, document version, user intent, and runtime load |
| Text and multimodal routes show different sensitivity across visual-density groups | Every chart query should use multimodal retrieval, or density grouping proves causation |
| Released prediction files let readers recompute aggregate metrics | Public files have independently reproduced end-to-end index construction and latency in a new environment |
Artifacts and reproducibility
As of October 20, 2026, the authors’ MIT-licensed GitHub repository exposes training code, retrieval and evaluation code, checkpoint links, dataset information, and prediction files. Its README lists 85,103 queries across 11 datasets and prediction spreadsheets for 8,506 unique test queries. The linked Hugging Face collection currently lists six RetrievalRouter lambda checkpoints, one baseline checkpoint, and viewers for all 11 datasets. A quick-start command recomputes aggregate nDCG@5 and mean latency from a released prediction file; the expected example is 0.754739 and 0.665978 seconds. The prediction spreadsheets allow readers to recompute aggregate metrics without running the full retrieval service. Re-measuring end-to-end latency requires rebuilding each route index and its serving environment. Performance figures in this reading remain author-reported. The repository uses MIT licensing, while each underlying dataset and model has its own terms.
The provided evaluation script and predictions make table metrics easier to inspect than a paper plot alone. Rebuilding retrieval latency end to end also requires text and multimodal indexes, separate software environments, and the relevant models, data stores, and hardware; the README’s setup steps do not imply identical results on arbitrary GPUs. An engineering reproduction could begin by sampling representative local queries, measuring relevance and serving cost for every route, and reserving a time-based or customer-based holdout to check for distribution shift.
Bloss0m engineering judgment: put the whole cost on the frontier before adoption
Bloss0m engineering judgment: If a product serves lexical lookups, semantic paraphrases, visual-document questions, and cross-section searches—and these query types show repeatable differences across routes on local data—query-level routing is worth prototyping as an experiment. Under a fixed corpus and serving topology, record route choice, per-route quality, mean and P95 latency, index memory and storage, build time, and update delay. Do not make the policy the only production path before it is validated against data and load. A reversible rollout can first log suggested routes, shadow-compare them with the fixed baseline, and then shift traffic gradually.
Do not adopt it directly when one inexpensive route already handles the workload; when multiple arms create duplicate or inconsistent indexes without a freshness policy; when a missed retrieval is unacceptable and there is no safe fallback; or when query distribution changes without labeling and drift monitoring. Switching from text extraction to visual models also changes failure modes and privacy boundaries. A single nDCG gain is not enough to decide.
Keep three quantities separate in the decision. First, measure retrieval quality against the product’s needs for relevance or evidence completeness. Second, measure online latency and resource use on the actual serving hardware and workload. Third, measure full lifecycle cost: building and storing multiple indexes, incremental updates, model serving, and observability. The paper primarily establishes offline operating points for the first two. It leaves the third for deployers to measure. Its 15 ms router-overhead estimate covers policy inference, not the cost of training labels or the lifecycle of every pipeline.
Three things to remember
- Technical idea: RetrievalRouter selects one of five query-only routes—BM25, text dense, text reranking, multimodal dense, or multimodal reranking—using soft reward targets rather than forcing one hard label among near-ties.
- Evidence: In the authors’ experiment on 11 datasets, 85,103 queries, and one H100, λ=0.1 reports nDCG@5 of 0.755 and mean latency of 0.666 seconds. The comparator and metric conditions are part of that claim.
- Boundary: An offline frontier is not total cost of ownership and does not guarantee transfer across corpora, languages, hardware, load, or index refresh. Validate it on local data before rollout.
Primary sources
- Kuru, Emre, Mehmet Onur Keskin, Reza Farahbakhsh, and Noel Crespi. “RetrievalRouter: Joint Modality and Architecture Selection for Document Retrieval.” arXiv:2608.25625v1, submitted August 26, 2026. See Sections 3–6, Tables 1–2, Figures 1–6, and Appendices A–B. Licensed under CC BY 4.0.
- Official RetrievalRouter repository, MIT license; code, datasets, checkpoints, training data, and prediction spreadsheets.
- Benchmark sources cited by the paper: REAL-MM-RAG, T2-RAGBench, and MMDocRAG.