Paper reading
Finding the Right Fit: How Models, Harnesses, and Tasks Change Agent Rankings
The paper in 90 seconds
- Problem: Model leaderboards rank models, but they do not answer a deployment question: does a model’s rank survive when it runs through a different tool loop, error policy, context manager, and stopping rule?
- Core insight: Treat the evaluated unit as an executed model × harness × task-collection configuration. A harness is the action loop and runtime policy around the model, including its tools, context handling, retries, timeouts, and completion rules.
- Strongest evidence: On the 63-task non-H100 subset of Terminal-Bench 4, Claude leads GPT by 7.94 percentage points in OpenHands, then trails it by 30.16 points in PI. GPT-6 Astra scores 60.32% at $4.66 per task with PI, versus 52.38% at $19.94 with DSH (paper Table 1, Figure 1, Sections 4.1–4.3).
- Main boundary: The authors count the final run for each task and do not estimate run-to-run variance. Model settings, tools, context management, and harness defaults are not all matched. This is a system comparison on limited task collections, not an isolated causal estimate of changing one harness component.
This reading follows the arXiv v1 preprint submitted on 1 October 2026. The paper asks neither “Which model is always best?” nor “Which harness wins everywhere?” Instead, it studies how harness and task selection reshape a model’s observed performance. The authors cross four configurable harnesses, five models, and three workloads, then inspect a small number of matched trajectories to see how failures reach the model. Two patterns coexist: most models have a different top-scoring harness across task collections, while some pairings retain an advantage in the three collections tested; runtime feedback also gives clues about score differences. The findings can help teams design more informative evaluations, but they do not replace repeated testing, a local cost ledger, or safety acceptance for a particular product.
First separate the model, harness, and task collection
In a typical tool-using agent, the model reads state, proposes a tool call, receives the output, and decides what to do next. The harness implements that loop. It determines which tools are exposed, how calls are serialized, whether errors return to the model, when long context is compressed, whether commands time out, whether a model can continue after an interruption, and when a run counts as complete. The harness is therefore more than a wrapper: it changes what the model can observe, what actions it can take, and how much opportunity it has to correct an error.
The third layer is the task collection. General terminal tasks, professional workflows, and difficult command-line tasks can place different demands on tool interfaces, computer use, long-horizon planning, and verification. The same model–harness pairing may fit each collection differently. The paper calls the highest recorded score empirical fit. For model (m) and collection (b), the authors select the highest-scoring harness among those actually evaluated:
This notation describes only which evaluated configuration scored highest in the observed sample. It does not predict untested harnesses or mean that a specific harness feature caused the entire score difference. The mean reward (S) uses the intended task count (N_b) as its denominator. A task with no verifier result in its final run is scored as 0; a numeric reward is retained when available. TUA-Bench and ALE-CLI allow partial rewards, while Terminal-Bench 4 is binary (Section 3.3). The three collection scores are not combined into one overall ranking.
The total of 66 configurations comprises 60 entries from four configurable harnesses—OpenHands, DeepSeek Harness (DSH), PI, and openJiuwen—crossed with five models on three collections, plus six native-reference entries: Codex–GPT and Claude Code–Claude, each on all three collections (Section 3.1). Native pairings are reference points, not proof that their tools, defaults, or model interfaces are fully matched to the other harnesses.
Why a model-only leaderboard is insufficient: prior limitation and core intuition
The simplified question “Is model A or model B stronger?” becomes three operational questions: Does the model ranking change with the harness? Does the best harness for one model change with the workload? Does a vendor’s native harness always make its model perform best? This framing helps prevent a full system’s score from being misread as the model’s isolated ability.
On Terminal-Bench 4, Claude Opus 5 completes 36/63 tasks in OpenHands and GPT-6 Astra completes 31/63. On the mean-reward scale, Claude leads GPT by 7.94 percentage points. With DSH, Claude gets 22/63 while GPT gets 33/63; with PI, they get 19/63 and 38/63. Across the four configurable harnesses, the Claude-minus-GPT differences are +7.94, −17.46, −30.16, and −12.70 points, respectively (Table 1, Section 4.1). The ordering reverses. This shows that the observed system ranking is not fixed; by itself, it cannot establish which individual harness feature produced the 38.09-point swing.
Figure 1 plots score against model cost per task, so that a higher score and the cost of execution can be considered together. Cost is the agent-model API cost at OpenRouter prices, including auxiliary model calls made by the harness and excluding evaluator calls; it comes from the same final run that determines the task reward (Section 3.4). The comparison therefore reflects the prices, tasks, and execution settings of this campaign, not a general purchasing estimate.
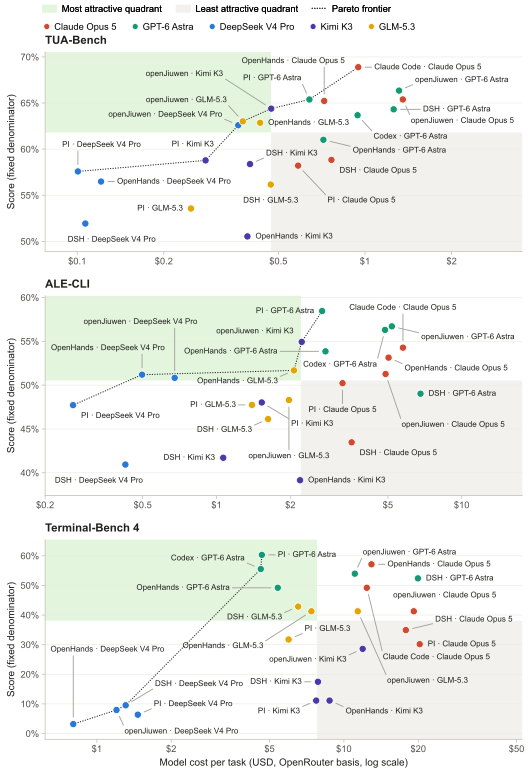
Original Figure 1, Section 4. Each point shows score and per-task model cost for a model–harness configuration on one of the three task collections. The dotted line is the Pareto frontier for that collection’s 22 configurations. The median quadrants are visual partitions, not common thresholds across tasks. The figure is reproduced unchanged from arXiv v1 Figure 1 under the preprint page’s CC BY 4.0 license.
Walk one example through the method: from a hang to usable feedback
The authors compare Kimi K3’s final scored trajectory on TUA-Bench task 056-move-textbox-left in openJiuwen and PI. This case shows one way a harness can change the opportunity to repair an error. It is not a controlled ablation or a representative estimate of all tasks (Figure 3, Section 5.1).
- Input and goal: The agent must move a text box to the left in GIMP and produce an image that satisfies the task. In both harnesses, the model uses shell commands to operate GIMP.
- The shared failure: Kimi pipes a GIMP script into
gimp -i -b -but omits the closing call(gimp-quit 0). GIMP therefore waits indefinitely for input. Both trajectories hit this same bug. - The PI path: PI’s shell has no default command timeout, and the model does not set one in this run. The call never returns, so no timeout output or error reaches the model. The run continues to TUA’s 40-minute deadline without a valid output file and receives reward 0.
- The openJiuwen path: The first two GIMP attempts crash, and their errors return to the model. Kimi moves the script into a file and simplifies it. The third attempt still uses the hanging construction, but the harness’s 300-second shell limit returns a timeout signal. Kimi diagnoses the missing
gimp-quit, discovers that the output image was already written, and checks the canvas dimensions, background color, and text position pixel by pixel. The harness’s re-check prompt triggers one last validation. The run takes about 11 minutes and earns reward 1.
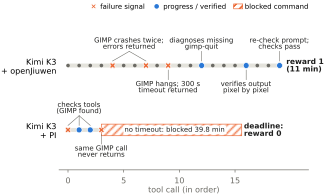
Original Figure 3, Section 5.1. Both runs encounter the same GIMP hang. A 300-second command limit turns the hang into readable timeout feedback in openJiuwen, while PI’s unbounded call continues until the task deadline. The timeout and re-check prompt are harness signals; the recovery diagnosis comes from the model, and success partly depends on the output file having been written before the hang. Reproduced unchanged from arXiv v1 Figure 3 under the page’s CC BY 4.0 license.
The trajectory supports a limited but useful interpretation: when a command stalls, an execution environment that returns an interpretable failure signal may give the model a chance to recover. When the failure becomes silence, that opportunity disappears. The PI run did not receive feedback, which is not evidence that Kimi cannot recover; the openJiuwen success cannot be attributed only to the timeout either, because the file was already written and the final re-check prompt also intervened. The two traces illustrate a plausible mechanism, not a causal result from isolating one variable.
Experimental design: three workloads with separate denominators
The evaluation uses 120 TUA-Bench tasks, 99 ALE-CLI tasks, and a 63-task non-H100 subset of Terminal-Bench 4. The paper characterizes them as general terminal use, professional workflows, and difficult command-line tasks, while noting that their workflow composition differs and they are not orthogonal capability tests. The Terminal-Bench subset is CPU-only/non-H100 from v4.0.0. ALE-CLI uses this campaign’s local-Docker selection rather than the full upstream leaderboard setup (Section 3.1, Appendix A).
The five models are Claude Opus 5, GPT-6 Astra, GLM-5.3, Kimi K3, and DeepSeek V4 Pro. Requests go through OpenRouter to each first-party provider, with fallbacks disabled. The authors request high reasoning effort from every harness, but the same label does not guarantee the same thinking-token budget. Sampling parameters follow provider defaults; context management, compaction, retries, and turn limits mostly follow each harness’s own defaults. One exception is OpenHands: the authors set its custom-endpoint context and output limits to 1M and 128K tokens. Harness tools also differ. On ALE-CLI, each harness additionally receives the benchmark’s fourteen computer-use tools. Task time limits follow the benchmarks: 40 minutes per TUA task, eight hours for Terminal-Bench, and up to two hours for most ALE-CLI tasks (Section 3.2, Appendix Table 5).
These details are interpretive conditions, not incidental setup. If a configuration has a different tool set, context policy, retry behavior, or stopping rule, the result measures that whole arrangement under this campaign’s conditions. To ask “Does changing only the timeout improve success?”, an evaluation would need to hold other factors fixed, repeat runs, and estimate variation. This 66-configuration comparison does not identify component-level effects in that way.
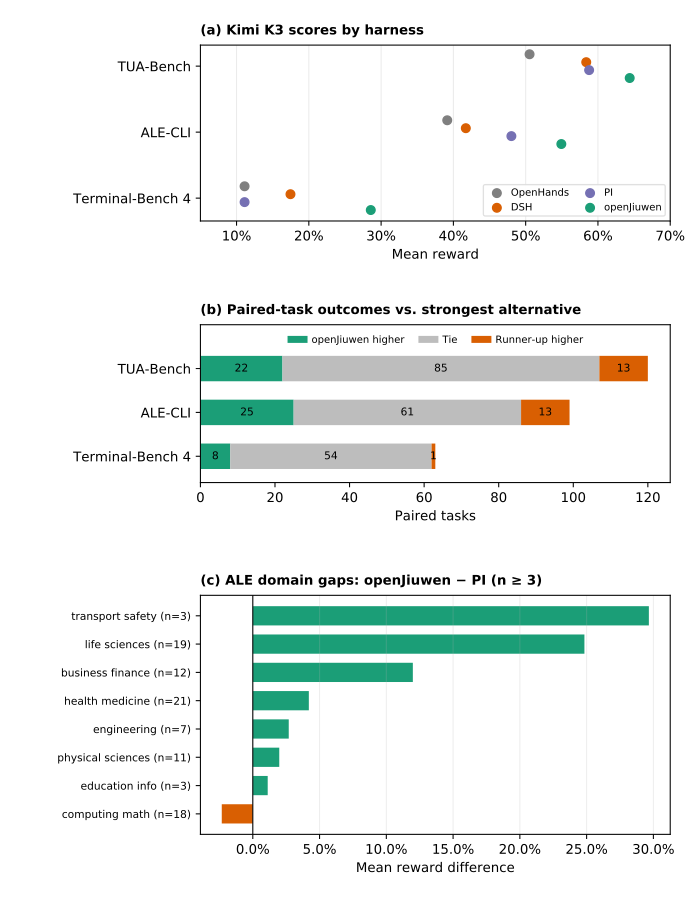
Original Figure 2, Section 4.2. Panel (a) compares mean reward for Kimi K3 in four configurable harnesses on the three fixed task sets; (b) compares openJiuwen with the strongest observed alternative configuration task by task; (c) shows mean paired differences by ALE-CLI domain, where a positive value favors openJiuwen. Its difference is negative in computing and mathematics. Reproduced unchanged from arXiv v1 Figure 2 under the page’s CC BY 4.0 license.
Result 1: most top pairings change, while Kimi is more consistent here
For each model and task collection, the authors identify the highest-scoring evaluated harness. Claude Opus 5’s top score comes from Claude Code on TUA-Bench and ALE-CLI, but from OpenHands on Terminal-Bench 4. GPT-6 Astra moves from openJiuwen on TUA to PI on ALE and Terminal. GLM-5.3 and DeepSeek V4 Pro also shift from openJiuwen to OpenHands and then to DSH. Four of the five models change their observed winner across the three task collections (Table 3, Section 4.2).
Kimi K3 scores highest with openJiuwen on all three: 64.39% on TUA-Bench, 54.94% on ALE-CLI, and 28.57% on Terminal-Bench 4. Its lead over the next-highest available harness is 5.61, 6.91, and 11.11 percentage points, respectively. The advantage is not explained by only a few outlier tasks. Against the strongest alternative in each collection, openJiuwen wins, ties, and loses 22/85/13 tasks on TUA, 25/61/13 on ALE, and 8/54/1 on Terminal. Removing the three largest positive gaps still leaves mean advantages of 3.11, 3.88, and 6.35 points (Figure 2, Section 4.2).
“Highest in all three collections” remains a result within this finite evaluation, not a universal guarantee. The ALE-CLI domain split makes the qualification concrete: relative to PI, openJiuwen leads by 24.83 points on 19 life-science tasks and by 11.99 points on 12 business-and-finance tasks, but trails by 2.32 points on 18 computing-and-mathematics tasks. An overall mean can hide a reversal within a particular domain. Teams with a known workload mix should inspect task strata rather than only one aggregate score.
Result 2: native pairings and spend do not choose a harness for you
Native harness comparisons are mixed. Claude Code is Claude’s top-scoring configuration on TUA and ALE, leading the best alternative by 3.50 and 1.14 points; on Terminal-Bench 4, OpenHands leads Claude Code by 7.94 points. Codex–GPT is never GPT’s top-scoring configuration: openJiuwen leads by 2.67 points on TUA, PI by 2.15 on ALE, and PI by 4.76 on Terminal (Table 2, Section 4.1). A vendor integration is a useful reference point, but this comparison does not support using vendor provenance as a substitute for workload fit.
Cost and score also do not move in one direction. On Terminal-Bench 4, GPT-6 Astra averages 60.32% at $4.66 per task in PI and 52.38% at $19.94 per task in DSH. Within this task collection and cost measure, PI has both the higher score and lower model API cost. That does not imply PI will cost less for another model, task, pricing date, or product. Task runtime, containers, and human operations are outside this model-API-cost measure (Figure 1, Sections 3.4 and 4.3).
Resource statistics for the same model offer clues about cost differences. On Terminal-Bench 4, GPT-6 Astra makes 2,560 calls and uses 110 million uncached input tokens in PI, compared with 11,879 calls and 673 million in DSH. openJiuwen serves 94–99% of its input tokens from cache, versus roughly 49–77% in the other harnesses (Appendix Figure 8, Section 4.3). These are observed resource profiles; they do not isolate how each harness feature produced them.
The number of calls alone also makes a poor efficiency score. In 18 of 20 TUA-Bench configurations and 17 of 20 Terminal-Bench 4 configurations, solved tasks use more model calls than failed ones. Only one of the 21 ALE-CLI configurations shows that pattern. A difficult task may require more steps precisely because the agent succeeds; call count is not a task-adjusted efficiency measure (Appendix Figure 9, Section 4.3).
Diagnostic evidence: what failure paths sit behind the rankings?
The trajectory analysis centers on a small set of matched cases: ten same-task, same-model OpenHands-versus-PI pairs on Terminal-Bench 4 (all five models), containing 192 actionable failure events from final scored runs, plus six Kimi pairs comparing openJiuwen with PI. Of the 192 responses, 180 were model-initiated. Diagnosis or a targeted patch was most common (69%) and resolved 116 of 133 such signals; strategy changes were less frequent but resolved all 16 signals; repetition occurred 11 times. Passing runs more often answered feedback with diagnosis or repair than failing runs (81% versus 56%) and almost never repeated themselves (1% versus 11%) (Section 5.1).
The statistics direct attention to how harnesses report failures and control execution. OpenHands’ stuck detector ended 55 runs after repeated identical failing actions; 48 involved Kimi repeatedly calling edit without the required content argument. Only one of those runs scored above zero. PI’s shell has no default timeout; 34 PI runs on Terminal-Bench and TUA became stuck in a final command that never returned, leaving no signal for the model. PI ends a run when the output cap cuts a turn short; OpenHands continues, while openJiuwen re-prompts the model with its partial reasoning preserved. The paper records 100 such resumptions, 48 of which later scored above zero. These events identify behavior that may relate to outcomes, but because the study does not randomize each default separately, they do not show that one setting caused a particular score increase (Section 5.1).
Figure 5 also separates intermediate progress from a correct deliverable. The authors manually inspect all 45 failed openJiuwen–Kimi tasks on Terminal-Bench 4 and find that the agent often preserves substantial intermediate work, while mistakes may occur in final verification and the completion claim. In the matched retro-console-soc case, Kimi’s openJiuwen output still has pixel errors, but it declares success using a self-built acceptance criterion; the DSH run on the same task produces an artifact that passes the grader. The paper reports seven extra Kimi turns rechecking against the same self-built oracle; the grader finds 123 of 61,440 pixels wrong. The mismatch readings are consecutive within each run’s own acceptance criterion and are not aligned in time, so they are not a point-by-point comparison of synchronized measurements (Figure 5, Section 5.2).
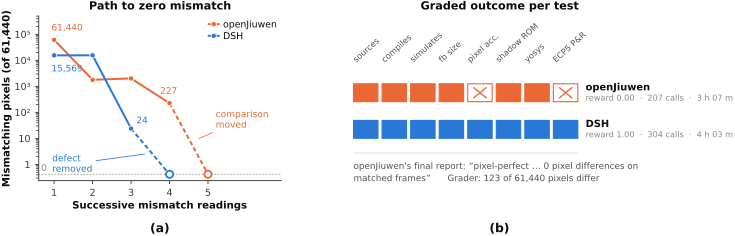
Original Figure 5, Section 5.2. The case compares Kimi K3’s delivery path in openJiuwen (final reward 0.00) and DSH (1.00), including each run’s mismatch readings against its own acceptance criterion. The paper says these readings are sequential within each trajectory, not aligned across runs. Reproduced unchanged from arXiv v1 Figure 5 under the page’s CC BY 4.0 license.
This counterexample also matters for trajectory training. A high reward does not necessarily mean that an agent’s policy meets a deployment requirement. The paper reports a GPT TUA CAPTCHA case in which openJiuwen’s generic continuation prompt leads the model to install an offline speech recognizer, transcribe the audio, and pass the check. The authors argue that if a deployment policy expects human escalation, this high-reward trajectory may not be a suitable positive imitation example. Reward, task delivery, and policy compliance are separate labels. This is an implication proposed by the authors, not a training outcome validated in this study (Sections 5.2 and 6).
Evidence map: observations, explanations, and open questions
| Question | Locatable paper evidence | What this supports | What remains unsupported |
|---|---|---|---|
| Can the model ranking change with the harness? | Table 1, Section 4.1; Claude–GPT differences on Terminal-Bench | The Claude/GPT reversal observed under these four harnesses | That one harness component caused the full gap, or a task-independent model ranking |
| Does the best harness change with workload? | Table 3, Figure 2, Section 4.2 | Four models change their observed winner across the three collections; Kimi–openJiuwen leads in these runs | The same winners for other models, tasks, or future versions |
| Do score and cost improve together? | Figure 1, Appendix Figures 6–8, Section 4.3 | Model API cost and score do not follow a fixed monotonic relationship in this campaign | All deployment costs, future prices, or total cost of ownership |
| How might feedback affect recovery? | Figure 3 and the matched GIMP case in Section 5.1 | A plausible recovery mechanism contrasting an unbounded hang with a bounded timeout | That timeout alone caused success, or Kimi cannot recover on any PI task |
| Does progress guarantee a correct deliverable? | Figure 5 and manual review in Section 5.2 | An agent can report completion using a self-built oracle that diverges from the task | That a reminder or extra self-check will ensure correctness |
The central conclusion is that model, harness, and task should be evaluated together, not that one should be collapsed into an overall leaderboard. The score matrix provides cross-configuration comparisons; cost and resource data add execution context; trajectory cases suggest inspectable failure mechanisms. These evidence types answer different questions: a matrix does not explain its own mechanism, one trace cannot estimate a general effect, and a cost curve does not include every deployment expense. Together they motivate better engineering hypotheses, but they do not remove the study’s design boundaries.
Limitations and interpretations to avoid
- No run-to-run variance: Each task is scored from its last run. Infrastructure failures or provider errors are rerun; the last run determines both reward and cost, and no valid outcome in that run receives zero. This defines the reported mean, but it does not show how much the same configuration varies across reruns. Close scores should not be treated as a settled ordering.
- Configurations, not isolated components: Model tools, reasoning budgets, sampling defaults, context compaction, retries, turn limits, and stopping conditions are not fully matched. A shared request for “high reasoning effort” does not guarantee equal thinking budgets. OpenHands’ context/output limits and the assembled openJiuwen agent also need to be considered when interpreting the comparisons.
- Task collections are not universal capability scales: Their task mixes differ; Terminal-Bench uses a 63-task non-H100 subset, and ALE uses 99 local-Docker tasks. These results are not direct replications of the upstream leaderboard scores and do not stand in for general software engineering, browser use, or organizational workflows.
- Limited trajectory sample: The detailed analysis covers ten OpenHands–PI pairs and six Kimi pairs. It can surface failure paths worth testing, but it cannot estimate an independent effect for each harness feature or establish a stable psychological trait of a model.
- The scoring rule can collapse unresolved states into zero: A final run with no verifier reward receives zero; only TUA and ALE provide partial reward. Completion and failure signals therefore enter the mean, but readers still need to inspect reward semantics, task content, and failure cause. Not all zeros represent the same capability failure.
- Cost scope is narrow and time-sensitive: The authors use OpenRouter model API prices, include auxiliary model calls, exclude evaluator calls, and count the scored run’s cost. Model prices, cache pricing, provider behavior, and omitted infrastructure, labor, and safety-review costs can all change deployment economics.
- Some attributions are interpretations: The paper attributes stream errors and sandbox stalls to harness resilience rather than model behavior. This is a useful systems-engineering interpretation of the traces, not proof that the model has no role or that the harness is the only cause.
Artifacts and reproducibility: public inspection is not a zero-friction rerun
As of 6 October 2026, the arXiv v1 page lists CC BY 4.0; the experiment GitHub repository is public and lists Apache-2.0 on its repository page; the Hugging Face trajectory dataset lists 6.2k rows and result information, and the dataset itself is marked CC BY-NC 4.0. The 6,204 scored trajectories are the release scope stated by the paper. The paper, code, and data have separate licenses and terms. The dataset’s noncommercial restriction does not disappear because the paper is CC BY.
These artifacts let readers inspect author results, sample trajectories, or reproduce some analyses, but a full execution still has material requirements: Linux and Docker, access to paid model APIs, about 100 GB of local ALE task images, and separate request-based access to some ALE task data. This article did not rerun the experiments; all scores are author-reported. Public code and traces do not constitute an independent reproduction, nor do they guarantee that a new run has the same benchmark or provider conditions. Before attempting replication, verify current data access, availability of each model API, and pinned versions, then record exactly which tasks were rerun.
Bloss0m engineering judgment: turn the findings into a local test plan
The following is Bloss0m engineering synthesis, not a product-selection formula validated by the authors. For a coding-agent deployment, start with a small set of representative tasks close to the real work and define how each output will be accepted. Version each candidate as a complete configuration: model, harness version, tools, system prompt, context policy, retries and timeouts, and model pricing. For every task, record more than success: retain cost, latency, model calls, tool errors, timeouts, human escalation, and gaps against the acceptance criteria. This prevents the result from collapsing to one aggregate score that cannot explain why a configuration performed better.
Then rerun each configuration. The paper’s one-run scoring rule lets the authors place 66 configurations in one comparison, but it does not estimate run-to-run variance. If a product choice depends on a point or two, measure variation locally or at least report the range across repeats. Fix the verifier for the test set and preserve distinct states for no result, timeout, environment failure, model error, invalid artifact, and policy refusal. Do not merge them into an undifferentiated zero. If the deployed product retries or hands work to a person, include that policy in the evaluation specification, because it affects both success and cost.
Next, inspect whether failures are observable and recoverable. For controlled command execution, use a reasonable timeout and return a compact, useful error. For retryable failures, bound retry count and cost. For steps that require human judgment, violate policy, or could trigger an irreversible side effect, define an escalation path. These are engineering suggestions prompted by the paper’s cases; they do not establish a universally correct timeout or prove that every model benefits from more guardrails. Treat them as candidate changes and measure success, error, cost, safety, and latency one by one.
Give final delivery an external check as well. If an agent says “done” using its own measurement but diverges from the task or evaluator, another self-check prompt may not fix a broken oracle. Rather than asking only for confirmation, verify that the check refers to the original acceptance criteria, that an independent verifier accepts the artifact, and that the agent stops explicitly when it cannot verify. This matters especially for browser tasks, financial workflows, data changes, deployments, and permission-sensitive operations. A high reward does not imply policy safety or acceptable delivery.
This paper should not be used to choose “openJiuwen everywhere,” “GPT always with PI,” or “lower API cost means higher efficiency” for a team. It does not cover untested models, workloads, isolation boundaries, tool permissions, or full operating costs; one execution per task is also insufficient to estimate reliability. When the deployment differs substantially from the three benchmarks, treat the paper as evidence for hypotheses to test, not a substitute for local validation.
For a related reading, Paper Reading #83, Agents Are Systems, Not Models, studies five agent configuration axes and repeat-run variance on scientific model-use tasks. This paper asks a different question: how harness choice reverses coding-agent rankings, changes cost, and shapes runtime feedback. For a follow-up on turning these failures into observable signals, see #87, AgentPProf; for turning natural-language requirements into checkable specifications, see #89, MAGS. These studies have their own tasks and evidence, so they cannot supply causal evidence left unmeasured here.
The same mean can also represent different risks under different task distributions. If a product has a small number of high-impact tasks, consider stratifying by task type and failure severity before comparing score, completion, recovery, and per-task cost. Alongside an equal-weight aggregate, a team can report common and high-risk task results separately; that is an engineering evaluation extension, not a new metric from the paper. Avoid treating a single-run fluctuation in a small stratum as a stable difference, and retain each subgroup’s denominator.
When recording configuration changes, keep model version, harness version, prompts, tool permissions, timeouts, retries, task images, and evaluator version linked to one another. Otherwise, a change in average score is difficult to attribute to a model update, a runtime policy, a task-environment change, or a verifier fix. This traceability matters when several teams share a harness: a platform team can expose consistent runtime telemetry, while product teams add acceptance tasks from their own domain. Teams need not use identical weighted scores, but they should state which tasks entered the evaluation and which errors trigger retries or human handling.
Three things to remember
- Choose the right unit: The paper’s observed fit belongs to the model × harness × task collection. A model’s leaderboard score is not guaranteed to carry across harnesses.
- Keep traces and cost beside scores: How a failure reaches the model, how it responds, and how the deliverable is checked can make an aggregate score diagnosable. Interpret cost using the same accounting boundary and the same scored run.
- One result is one result: The 66-configuration breadth is useful, but one final run per task, unmatched defaults, selected task subsets, and a small matched-trace analysis leave general rankings and causal claims unresolved.
Primary sources
- Li, Yixuan, et al. Finding the Right Fit: Model–Harness Interactions across Agent Tasks, arXiv:2610.00917v1, 1 October 2026. Main evidence anchors: Tables 1–3, Figures 1–5, Sections 3–6, and Appendices A–D.
- Experiment code and configurations (README and default configurations; repository license listed as Apache-2.0).
- Finding the Right Fit trajectory dataset (6.2k rows; dataset card lists CC BY-NC 4.0).