The paper in 90 seconds
- Problem: An agent team can use a single trace to find when one request failed, but it is harder to aggregate weeks or hundreds of runs by shared task or workflow phase. That makes questions such as “Which work consumed the most tokens?” or “Do failures keep getting stuck at the same step?” difficult to answer. Traditional profilers have a foldable function call stack; agent intent appears in varied language and has no runtime stack to attribute it to.
- Core insight: Normalize each activity as an operation, infer nested semantic intervals from the trajectory, and project resources onto operation stacks so matching paths fold across sessions. The same annotations can be viewed by tokens, time, or operation count.
- Strongest evidence: Across 405 CodeTraceBench trajectories and 2,948 human-annotated stages, the authors report a B³ F1 of 0.764 (0.663 for a statistical recurrence baseline and 0.541 for raw actions). Combining the profiler with each benchmark’s own diagnostic raises MAP by 0.031, 0.107, and 0.117 on three fault-localization workloads.
- Main boundary: These are author-reported evaluations on specific public data and real trajectories, not an independent rerun by Bloss0m or a guarantee about production root causes. Task intervals are assumed to be contiguous and recursively segmentable; flame-graph width represents a selected additive measure, not proof that an activity caused a failure.
This reading follows the arXiv v1 preprint submitted on September 14, 2026. The paper begins with three failed attempts at the same Git deployment task: 489 operations and about 4.6 million tokens scattered across prompts and shell commands. Reading every transcript takes time and does not readily reveal a shared problem or distinguish the amount of work from model cost. The authors change the question from “debug this trace” to “profile task intent across runs,” replace function names with semantic intervals, and emit the result in the familiar pprof format. In the three failed runs, authentication diagnosis accounts for 21% of operations but 46% of tokens. That is a useful observation to investigate, not a universal law about agent failures.
Why per-run traces are not enough
A trace, span tree, or timeline can show the model calls, tool results, and event order in one session. That detail matters when asking why one deployment failed. But to learn how much input-token budget went to retries or file reading across a hundred code reviews, engineers first need a way to group equivalent work. A traditional CPU profiler can fold samples because each one carries a stable function call stack. Agent intent is expressed in natural language: the same task may appear as “fix the login bug,” “token auth keeps failing,” or a shell-based check. Raw text is not a reliable shared key.
The authors distinguish two layers. The upper layer is agent intent: prompts, LLM calls, and tool invocations. The lower layer is the processes, file reads and writes, and network requests triggered by those tools. One tool invocation can create several lower-level effects. If classification stops at API requests, responsibility labels do not naturally flow to downstream work; if engineers inspect every record, analysis returns to unscalable manual review. AgentPProf’s design problem is to connect these layers while keeping evidence traceable to source operations (Sections 1–2).
Core intuition and method mechanism: semantic responsibility stacks
A conventional function profiler treats a call path as a responsibility hierarchy, such as main → parse → tokenize. AgentPProf cannot read a real runtime stack, so it constructs an operation stack from fields selected at query time. An operation is a record with string fields and additive measures. A prompt, model call, tool, GUI action, file read, or process event can share the same representation. Fields may include project, agent, session, task tag, kind, model, path, domain, or status; measures may include token count, duration, or event count (Section 3.1).
For an operation , let the selected field sequence be . Its projected path is . Operations with the same path are merged by summing the selected measure. Engineers can group the same operations by task, phase, session, or action without re-parsing the original events. This resembles aggregation by label, except semantic labels must remain stable across different sessions. Recursive operation segmentation supplies that missing structure.

Original Figure 2, reused under the CC BY 4.0 license listed by arXiv v1. Segmentation runs once per trajectory; projection and folding can be repeated at query time. The diagram illustrates the data flow, not a measured profiling accuracy. Source: arXiv v1, Figure 2, Section 3.
Walk one worked example through the method: a failed Git deployment
The paper’s motivating case has three coding-agent sessions attempting to deploy a Git service with a password-authenticated endpoint. None delivers the requested result. The three transcripts contain 489 operations and about 4.6 million tokens. Reading each command reveals what happened locally, but different runs describe the same intent differently, so they are difficult to align directly.
- Input: Local Codex and Claude Code JSONL conversations, plus lower-level process and file events captured by AgentSight. Each source is parsed into operations. Recorded tool or event IDs are reused when available; missing links use rules such as process-lifetime overlap, while ambiguous relationships are left unassigned rather than forced into a parent (Section 3.1).
- Find responsibility changes: A recursive segmenter reads prompts, commands, and output summaries, marking sparse points where responsibility changes. The root task may be “build deployment system,” with a child interval named “diagnose authentication.” Operations after each mark inherit that path until the next transition.
- Construct paths: Operations receive nested paths such as
build deployment system > diagnose authentication. Matching short names align across the three sessions, while the underlying LLM and tool evidence remains available at the leaves. - Change the measure and fold: Authentication work accounts for 21% of operations, 46% of tokens, and 37% of elapsed time. The hierarchy stays the same; only the width measure changes (Sections 2 and 5.1; Figure 1).
- Form a testable hypothesis: Expanding the path shows all three agents trying SSH alternatives without establishing the target service’s authentication endpoint. The profile suggests validating credentials earlier or bounding retries. That is a repair direction inferred by the authors from the records, not a causal finding proved by the flame graph itself.
Figure 1: one hierarchy can answer different questions
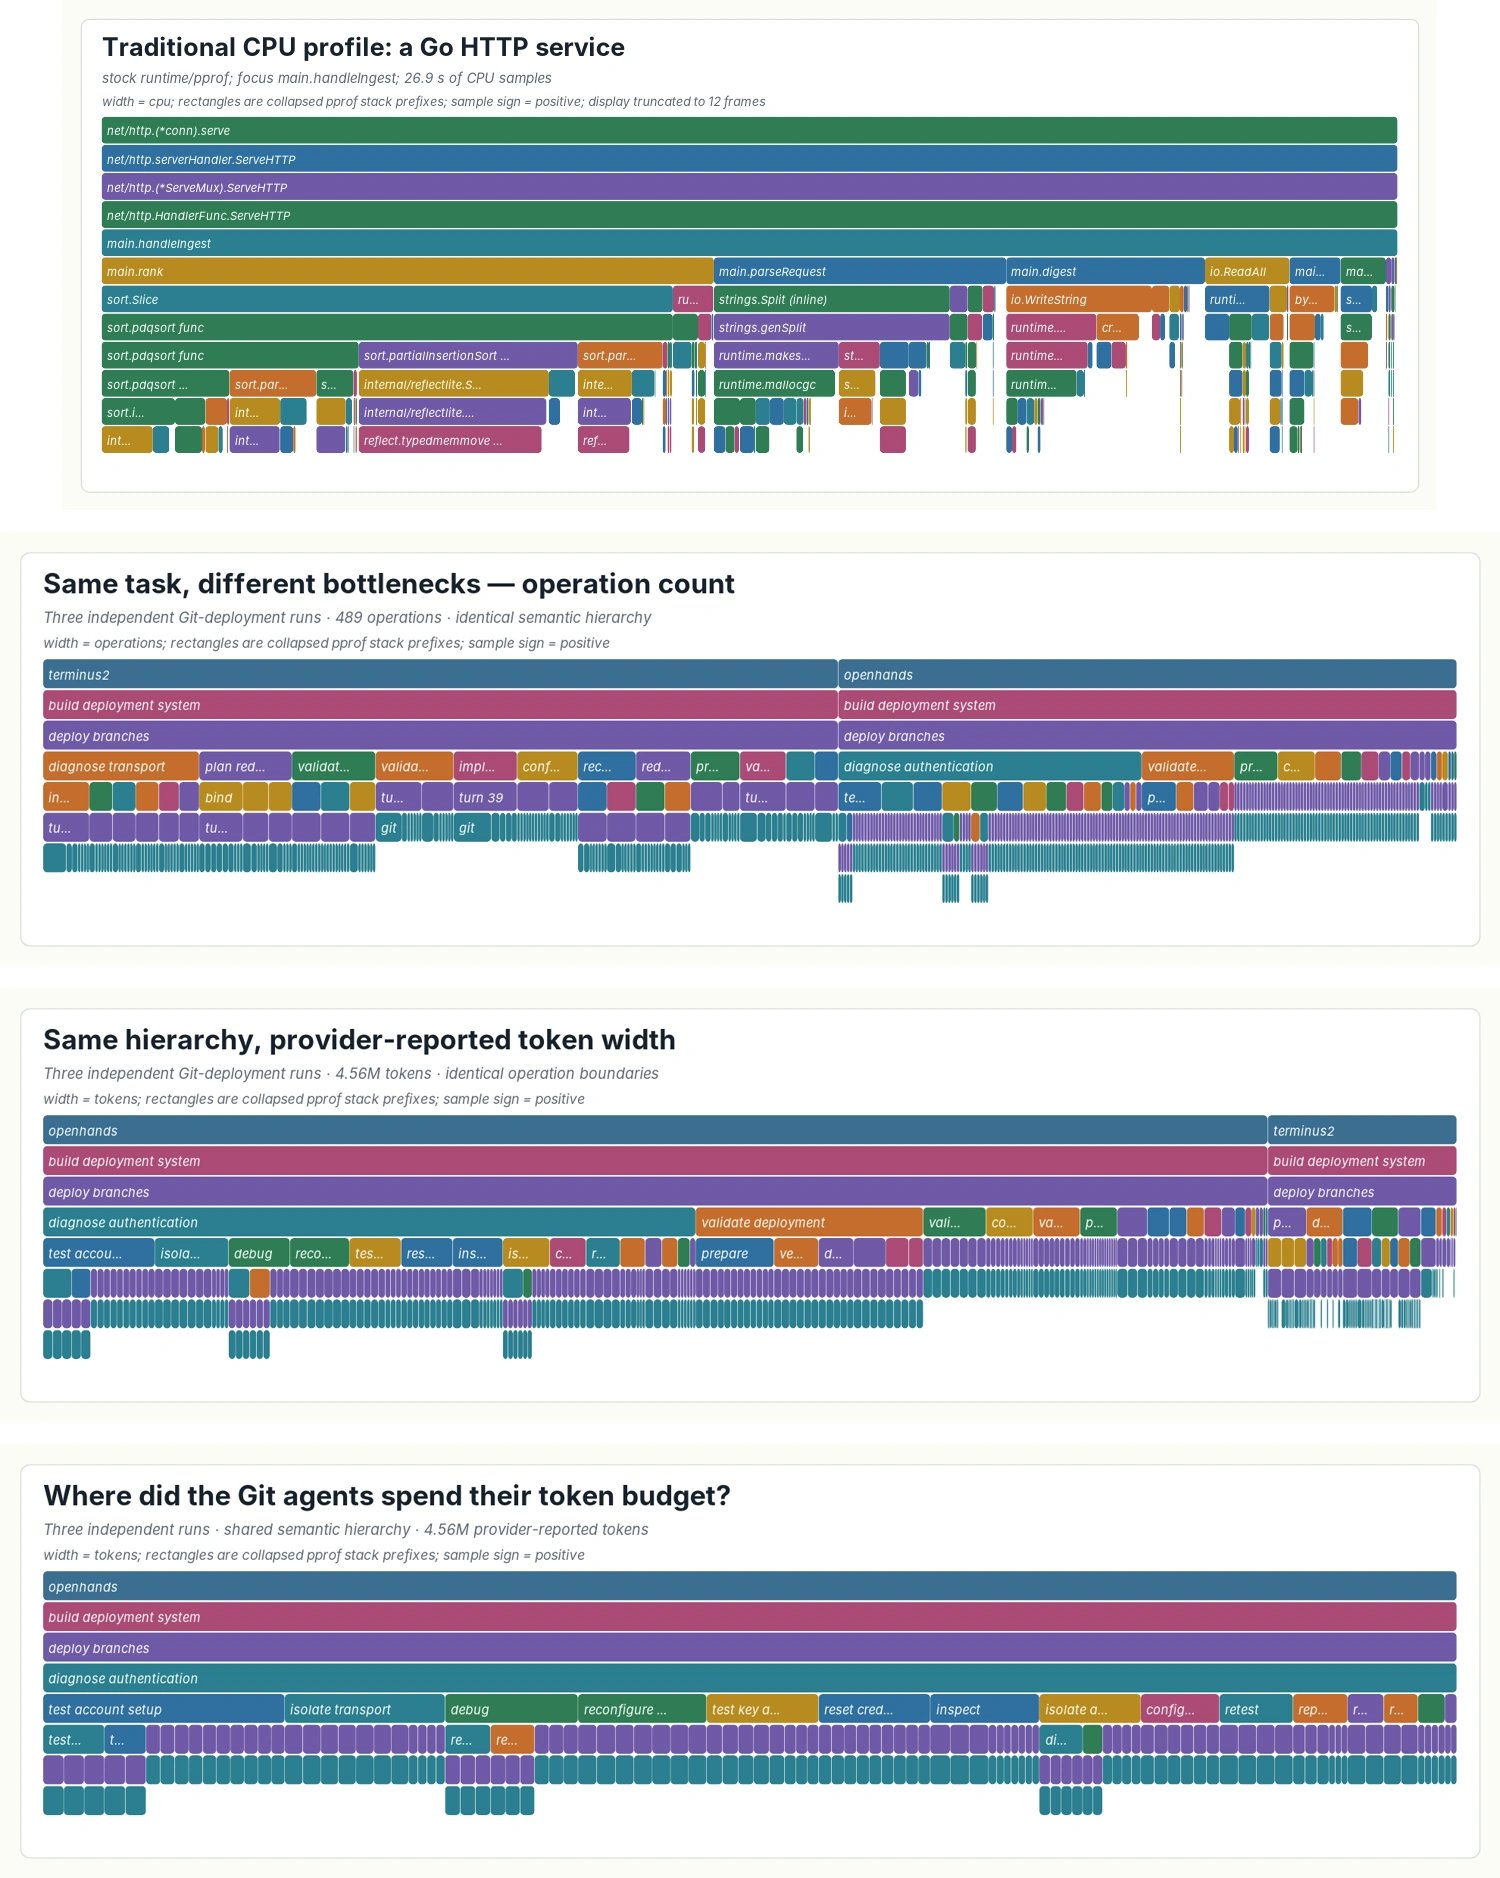
Original Figure 1, reused under CC BY 4.0. Panels b and c reweight the same agent hierarchy by operation count and tokens, showing that “many calls” and “many tokens” are different hotspots. Panel d expands authentication into account, transport, credential, and retest work. Source: arXiv v1, Figure 1, Section 2.
This example shows how the label scheme and selected measure affect a decision. Operation count may give many cheap commands more visual weight than a few expensive LLM turns; token width may do the opposite. Neither is the only correct view: network or file effects may matter for a risk question. The standard pprof format supports interactive expansion and measure changes, but the profile remains an aggregation. It cannot replace a source trace or a security review.
How recursive segmentation creates stable names
The authors assume that a task occupies a contiguous span in a trajectory and can be recursively divided into contiguous subtasks. Let denote the ordered steps. The segmentation is a set of nested intervals: any two intervals are either disjoint or one contains the other; the root covers the session, and every step is covered. At each call to , transition points split interval into consecutive child intervals. Each child is named and segmented recursively; a branch stops when there is no further transition (Section 3.2).
Semantic names belong to responsibility intervals, not individual prompts. For the principal evaluation, Codex reads the prompts, commands, and output summaries visible in each trajectory (without labels or scores), marks sparse changes in the path, and can revise those marks until satisfied. The paper uses Codex GPT-5.6-sol-high for this step. It consumes model tokens and means that the summaries sent for labeling belong in the data-governance plan. The CLI checks that intervals are nested and cover the sequence, then emits a standard pprof protobuf. Projection and folding are deterministic afterward (Sections 3.2 and 4).
This representation does not claim that “the language model knows the true intent.” It creates readable operation names from trajectory content and tests their usefulness against human annotations and downstream localization tasks. A missed semantic transition merges different responsibilities; over-segmentation splits similar work apart. The main B³ result leans toward purer but finer groups: precision is 0.793, above recall at 0.736, while boundary F1 is only 0.480. Those diagnostics qualify the headline 0.764 B³ F1 (Table 1; Section 5.3).
How to read the evaluation: label agreement is not the only question
The paper uses three data groups to examine different claims: real coding and web-agent trajectories for resource attribution; human-annotated or public-label datasets for segmentation; and three fault-localization benchmarks for whether profiles add ranking signal to existing diagnostics. The authors report eight public benchmarks and three real-trajectory datasets. Labels and fault answers are withheld from methods until their outputs are fixed. Sources include CodeTraceBench, OSWorld-Human, AgentBoard, AgentProcessBench, HINTBench, and TraceElephant (Section 5). The range is broad, but each sub-study asks a different question and uses trajectories of different lengths; one score should not be read as a single measure of capability.
To study failures, compare them with successful runs
The 440 web-agent trajectories cover 125 tasks: 202 successes and 238 failures. The authors pair successful and failed runs within each task, yielding 338 paired occurrences, profile each group, and subtract “successful” from “failed” to form a differential view. Failed runs spend 44.6% of steps in recover interaction—retrying, searching again, and navigating again—compared with 12.0% for successful runs. The hierarchy further separates recovery into verification problems, repeated searches, mistaken navigation, and record retries (Section 5.2; Figure 3).
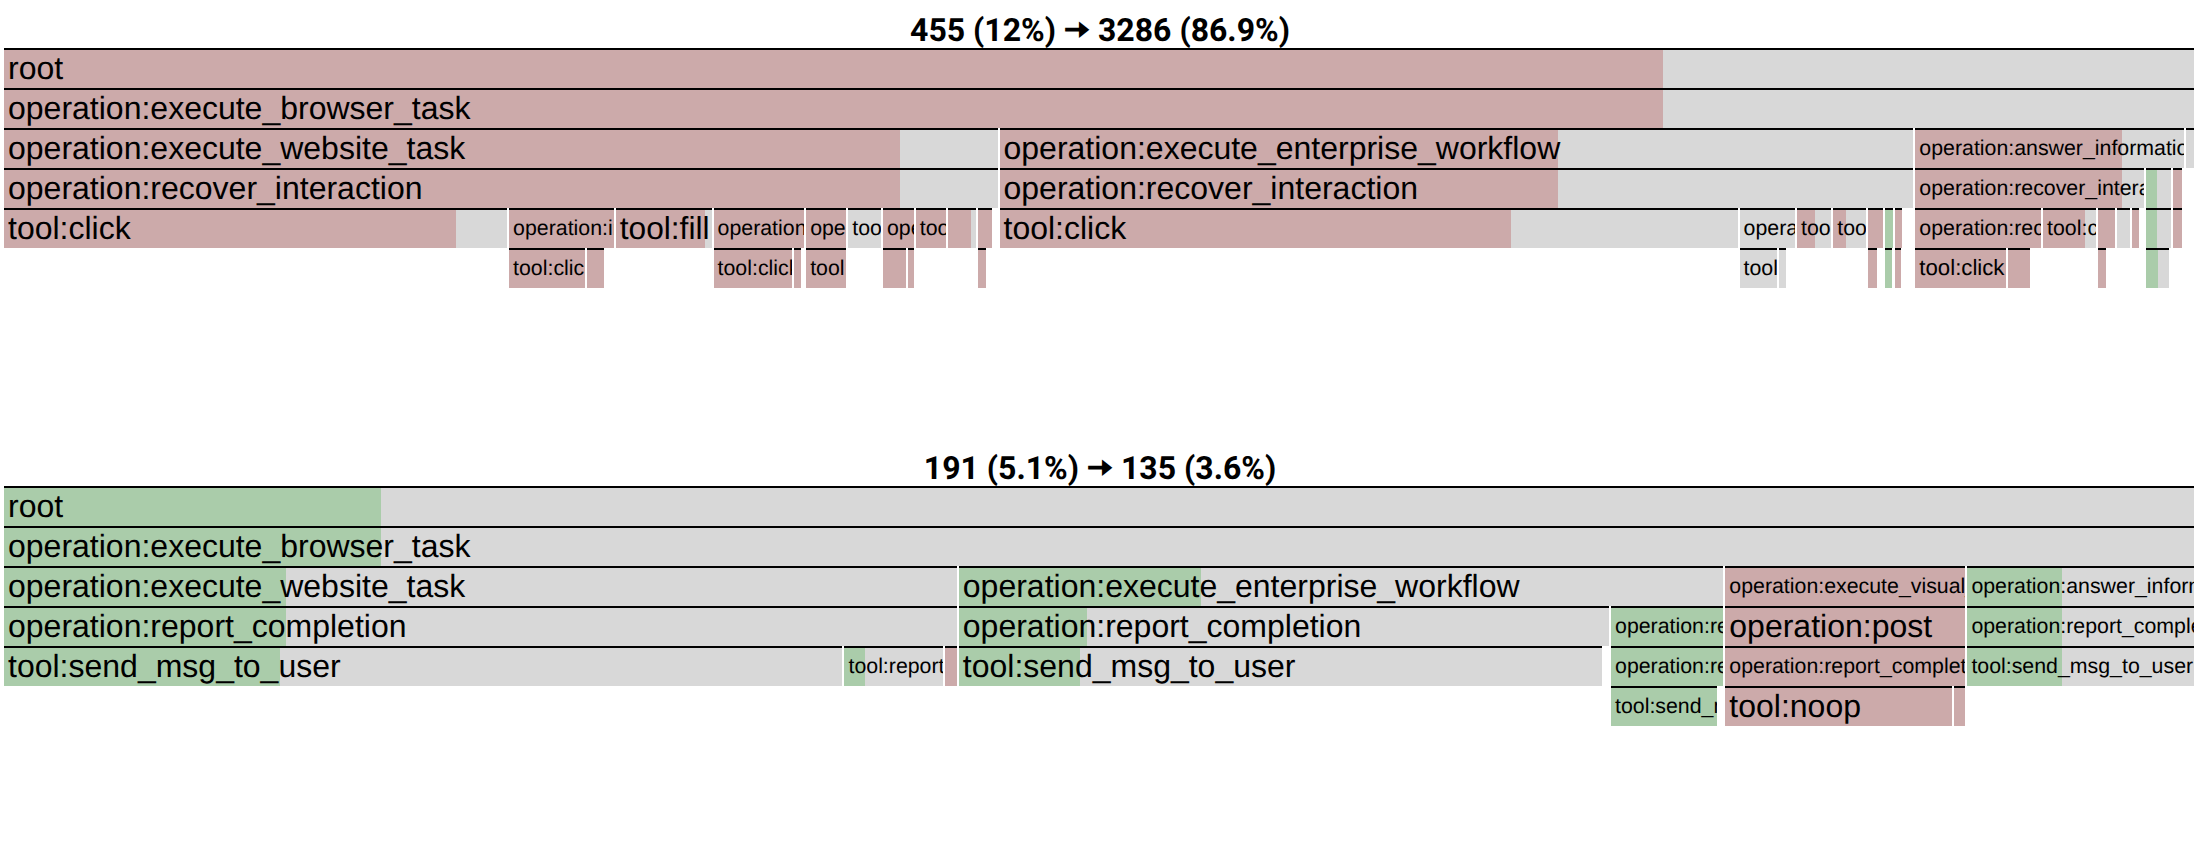
Original Figure 3, reused under CC BY 4.0. The graph compares failed minus successful behavior; rose means excess on the failed side, green means excess on the successful side. Box width sums both contributions, while the inset shows the net difference. The authors also compare differential profiles with expert looping labels on 435 trajectories: AP is .634, versus a .398 random baseline, with a difference interval of [.181, .293]. A fixed-chain repeat/error control reaches .656, suggesting that recursive grouping is not required for loop detection itself; it does provide an expandable responsibility path. Source: arXiv v1, Figure 3, Section 5.2.
The authors interpret this as evidence that failing agents get stuck in retry loops. It is not an estimate of failure causes for all web agents: the data come from a particular benchmark, pairing procedure, and expert labels. The fixed-chain baseline also has slightly higher AP. The recursive semantic hierarchy’s advantage is inspectability and source navigation, not necessarily a better single classification score.
A profile supplements diagnosis; it does not replace it
On the released test snapshots for AgentProcessBench, TraceElephant, and HINTBench, the paper uses 536 of the 629 reported trajectories. The MAP evaluation includes 614, 400, and 220 queries with labeled faults, respectively. Another 522 trajectories without an annotated faulty operation count toward data coverage but not MAP. The authors compare each benchmark’s per-operation diagnostic (Direct-only), the profiler alone, and a combination that uses profiler group scores to break ties in the original diagnostic ranking (Direct+AgentPProf). The combined method raises MAP over the original diagnostic by 0.031, 0.107, and 0.117; the paper reports the differences as statistically significant (Figure 4; Section 5.2).
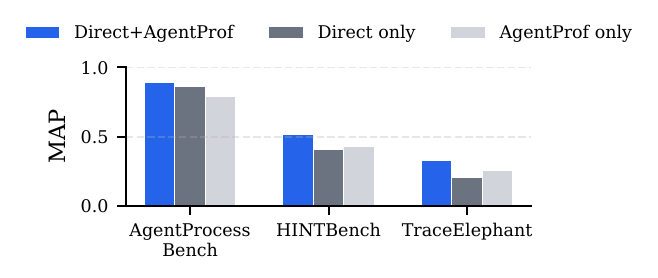
Original Figure 4, reused under CC BY 4.0. Direct+AgentPProf is higher than Direct-only on all three workloads. This is not a result in which the profile alone replaces the benchmark judge’s full fault diagnosis. MAP includes 614, 400, and 220 queries; higher is better. Source: arXiv v1, Figure 4, Section 5.2.
The trade-off is clearer in the profile-guided reading study on TraceElephant. Full-trace reading reaches MAP .502 at 12.6K tokens per query. A profile-guided reader selects at most five groups, reaches .455, and opens 53% of the source. Using raw-action names opens 65% and reaches .465. Reducing inspection has a cost: without semantic expansion, ranking quality drops slightly. This makes profiling useful for triage and navigation, but it should not replace the underlying records in a high-stakes investigation (Section 5.2).
Turning a profile into a repair to test
Across eight ToolSandbox scenarios, a profile-only analyst identifies a recurring call-ID syntax failure (5 of 21 tool operations) and points to the compatibility layer as a repair target. After a one-line fix, the authors test 23 held-out confirmation scenarios (69 before/repair pairs): agent tokens fall by 19.0% while the cases still pass a fixed official-similarity quality threshold (Section 5.2). This is a profile-guided repair evaluated on held-out scenarios, not an experiment in which the profile automatically fixes an agent. It does not imply a 19% saving across workflows.
Segmentation quality, measure conservation, and profiling cost
The CodeTraceBench evaluation contains 405 trajectories, 20,866 operations, and 2,948 human-annotated stages. Codex segmentation reaches B³ precision / recall / F1 of 0.793 / 0.736 / 0.764. The statistical recurrence baseline reaches 0.782 / 0.575 / 0.663, and raw-action grouping reaches 0.891 / 0.388 / 0.541. For boundary F1, Codex reaches 0.480 and the strongest automatic baseline 0.266. Higher precision with lower recall suggests that predicted intervals often remain relatively pure, while still splitting work finely or missing some genuine transitions. B³ and boundary F1 ask different questions and should not be collapsed into one score (Table 1; Section 5.3).
The authors also test other segmenters on OSWorld-Human: supervised Naive Bayes reaches 0.816 B³ F1, no-LLM recurrence reaches 0.786, and the unmodified Codex instruction reaches 0.448 at the coarser task-level granularity. This shows that the framework can host different segmenters; it does not establish that an LLM must beat rules. A mismatch between the model and annotation granularity can materially affect segmentation (Section 5.3).
Given fixed marks, profile construction can be replayed deterministically. The authors report 1.16 seconds and 465 MiB peak RSS for a 27,765-operation union; operations and token views over 440 trajectories take 0.26 and 0.25 seconds. One-time semantic annotation costs more: Codex segments all 405 CodeTraceBench trajectories in 37 minutes with up to four workers, averaging 29,754 input and 573 output tokens per trajectory. A compact skeleton plus selected full outputs reduces provider tokens by 20.4% relative to sending every turn’s complete content on 32 held-out task clusters, while meeting preset B³ and boundary-F1 quality thresholds (Section 5.4).
For an operations team, “profiles are fast to query” does not mean “semantic profiling is free to create.” If trajectories arrive daily, the team must decide what to relabel, how to cache it, when to inspect samples, whether to use a statistical segmenter, and whether provider data terms allow command and output summaries to be sent. Recalculate cost with the actual model, token price, cache policy, and retention settings. The authors’ 2026 token counts and timing are not a current procurement estimate.
Evidence map and claim boundaries
| Question | Paper evidence | What it supports | What it does not support |
|---|---|---|---|
| Does semantic segmentation approach human stage labels? | 405 CodeTraceBench trajectories, Table 1; B³ F1 .764 and boundary F1 .480 | Under this dataset and protocol, Codex path groups have higher stage agreement than the listed automatic baselines | That all agent families and tasks receive equally good intent labels |
| Does the profile reveal common failure behavior? | 440 web runs, Figure 3; recovery is .446 of failed runs and .120 of successful runs; expert-loop labels on 435 trajectories | On this benchmark, the differential profile reflects retry-like behavior and can navigate to source | That retries caused the failures, or that 44.6% is a general production failure rate |
| Can profiling improve fault ranking? | Figure 4 across three benchmarks; Direct+profile adds .031 / .107 / .117 MAP over Direct-only | In this ranking setup, profile grouping can supplement existing diagnostics | That the profile alone beats human/judge diagnostics or replaces per-run debugging |
| Can a profile reduce cost? | A repair tested on 23 ToolSandbox confirmation scenarios; tokens fall 19% and the quality threshold holds | One profile-guided repair reduced tokens on held-out cases | That every repair or task saves 19%, or that the effect transfers |
| Is construction lightweight? | 37 minutes to segment 405 trajectories; fixed-mark profile construction takes about a second | Segmentation dominates cost; later views can be replayed quickly | Equivalent throughput or cost for every dataset scale, model API, and deployment |
Main limitations: width is not causality, and labels are not ground truth
- Contiguous work is an assumption. Recursive intervals assume responsibility forms adjacent spans. If an agent interleaves subtasks, runs work in parallel, or returns to a task later, the interval model may be unnatural or group unrelated actions under one semantic parent.
- Label conventions need governance. How different prompts are named as “the same work,” and what granularity counts as one task, can change the folded profile. The authors measure agreement against CodeTraceBench human stages, but B³ F1 is not semantic correctness and boundary F1 is 0.480.
- Attribution is not causality. Even when token width is conserved exactly, assigning 46% of tokens to a task means that consumption was grouped under that path. It does not show that the task caused overspending or a deployment failure. Diagnosis should return to the operations and source records.
- The sample and long-horizon coverage are uneven. The paper mixes short-to-medium benchmark trajectories (8–52 operations on average) with long sessions from the authors’ workstation; part of the long-horizon data comes from one developer. Cross-platform stability across teams, models, tools, and enterprise policies remains untested.
- Model and human costs matter. The main segmenter uses GPT-5.6-sol-high, and prompts or output summaries may contain confidential data. Time saved during diagnosis must be weighed against labeling fees, privacy review, and correction of mislabeled intervals.
- The preprint appendix is not fully visible. The arXiv v1 working paper provides its main text and figures, but the technical appendix content is commented out in the supplied source. To reproduce every annotation prompt, statistical check, or cost detail, readers should verify the authors’ supplementary materials and code version.
Artifact and reproducibility
As of October 5, 2026, arXiv v1 is public. The AgentSight repository cited by the paper is public and uses the MIT License. The repository has since received releases; its current ext/pprof provides an agentpprof CLI that reads local Codex and Claude Code histories, emits pprof-compatible output, and supports rule-based tags or a local LLM. This establishes that the same project has a usable profiling artifact; it does not show that the current version is line-for-line equivalent to arXiv v1. The public repository does not pin the exact commit, data snapshot, or model environment used for the paper’s experiments, so a reproducer must resolve that version mapping separately. The benchmark results here remain author-reported; no independent rerun was conducted for this reading.
The paper describes sending prompts, commands, and output summaries to Codex for segmentation; the current repository documents newer taggers and workflows. Before deployment, compare the chosen release or commit with the paper’s settings, especially the labeling algorithm. Even when profile construction runs locally, labeling with a hosted model sends necessary summaries to that provider. A local model, explicit session-file list, or local regex rules can reduce data egress, but does not automatically secure the original session files.
Privacy deserves particular attention. The AgentSight README and profiling guide warn that histories may contain prompts, responses, commands, paths, headers, and network targets. Although default pprof and SVG outputs generally retain labels and weights rather than raw prompts, semantic labels can still expose project or user information. The current documentation requires Linux privileges for live eBPF capture, and concrete support varies by agent and platform. Enterprise use should first define data minimization, access controls, retention, provider terms, redaction, and export policies; treat both raw traces and profiles as sensitive. The results in this article are author-reported, not independently reproduced.
Bloss0m engineering judgment: use the profile as an index, not a verdict
The following is Bloss0m engineering synthesis, not a general rollout recipe claimed by the authors:
- Start with one concrete decision, such as cost attribution or retry failures, and choose tokens, time, or effect counts explicitly. Inspecting several measures helps avoid confusing frequent-but-cheap activity with rare-but-expensive work.
- Define label granularity, contiguous-interval rules, and a human sampling process. Keep sampled traces, segmenter/tagger versions, revisions, and confidence notes; pay special attention to task switching, parallel subagents, and long waits.
- Use the profile to find candidate paths, then follow each path back to operations and traces. Test cost or safety repairs on held-out work. Call an intervention useful only when it improves prespecified measures such as quality, cost, or failure rate.
- Decide data access, retention, and export fields before deployment. A profile label may be more anonymous than raw text, yet still disclose a repository, customer, task type, or incident.
Do not use it as an online risk blocker, causal analyzer, universal cross-model task ontology, or the sole basis for assigning blame to an agent or engineer. For interleaved, non-contiguous tasks, data that cannot be processed locally or by an approved model, or workflows that cannot trace profile groups back to source operations, use ordinary traces and human sampling first.
For a related threat to observability, read How Agents Can Tamper with Their Own Traces. The papers study different problems, but both make the trust boundary of observational data explicit. For evaluation, GameLogicBench: Testing Gameplay Logic with Tick-Level Assertions offers a useful contrast between aggregated traces and executable behavioral scoring.
Three things to remember
- Technical idea: AgentPProf supplies the stable responsibility paths missing from agent trajectories with operations and nested semantic intervals, then projects them into pprof-compatible stacks.
- Evidence: The authors report 0.764 B³ F1 on 405 CodeTraceBench trajectories. Combining profiles with existing diagnostics improves MAP on three fault-localization benchmarks, but does not replace the diagnostics.
- Boundary: Interval labels, source traces, and additive measures all require human governance. Area is not root cause, and public code does not mean the reported results have been independently reproduced.
Primary sources
- Zheng, Yusheng; Chang, Chaokun; Mao, Yu; Wu, Tianyuan; Huang, Yuxi; Ma, Tao; Mao, Wenan; Cheng, Shuyi; Quinn, Andi; Wang, Wei. “AgentPProf: Semantic Profiler for Long Horizon AI Agents”, arXiv:2609.20301v1, submitted September 14, 2026. Full text and Figures 1–4, licensed CC BY 4.0.
- AgentSight source repository, MIT License; see the current agentpprof guide and privacy/redaction notes for the later implementation and data boundary.