Paper reading
Agents Are Systems, Not Models: Why Agent Evaluation Must Go Beyond Model Scores
The paper in 90 seconds
- Problem: Agent benchmarks often treat a system as one fixed model configuration and report a success rate. In reality, task information, model, tools, reasoning state, runtime, and verification can all change behavior—and repeated runs of the same setup may differ.
- Core insight: Evaluate the configurable agent system. Across four AI-for-science tasks, the authors vary five configuration axes and separately measure completion, minimum-signal success, distance from a specialist reference, cost, and whether an agent can assess its own result.
- Strongest evidence: In the three tasks where gap-closed is defined, giving the agent more task information has the largest effect of the measured axes; it ranks first in at least 99% of bootstrap samples. The main experiment has 432 configurations per task, each repeated five times, for 8,640 runs.
- Main boundary: About 54% of score variance among hurdle-clearing attempts comes from rerunning the same configuration, showing that a single score is unstable. But the study covers only four specialist-model tasks in astrophysics and genomics—not all agent benchmarks, long-running multi-agent systems, or workplace workflows.
This is not a contest to find “the strongest model.” It asks a more operational question: when a model must operate a scientific specialist model, should we change the backbone, provide more information, preserve reasoning, ask for verification, or allow more time? The authors hold the tasks and tools under control, vary five settings, then track completion, score, variability, cost, and self-assessment together. The counterintuitive result is that task information often matters more than a larger model or a longer budget, while repeat-run noise is large enough to make a one-off benchmark score misleading.
This reading follows the arXiv v1 preprint submitted on October 1, 2026. The authors say they will release the code, benchmark, and 18,240 trajectories. As of October 3, the public GitHub README still says the full code and benchmark are coming soon and links to a trajectory dataset. The results below are therefore author-reported, not an independent rerun by Bloss0m or an external reproduction.
Why the prior approach is insufficient: a fixed model score hides a configurable system
Model benchmarks often compare models under a fixed prompt, tool set, or single run. This can be useful: if the task is text-only and context and reasoning are controlled, differences between models can be a meaningful signal. An agent, however, is not just a mapping from input text to output text. It repeatedly reads state, calls tools, observes results, and chooses what to do next. A harness controls that loop, including tool interfaces, context handling, memory, policy, and resource limits. Changing only the backbone—or reporting one success rate—can attribute differences to the wrong part of the system.
The authors are not trying to create a universal “agent IQ” score. They ask a narrower, more controllable question: when an agent must find and correctly operate a published specialist model, which settings change its effectiveness and reliability? The specialist has a paper and reference performance against which the agent’s result can be compared. The agent must also find information, prepare inputs, write code, and run the model, making failures in tool use observable.
That choice also defines the paper’s external-validity boundary. The benchmark is closer to research-code reproduction and specialist-tool operation than to an agent freely proposing hypotheses, designing experiments, or completing an entire research project. The contribution is a controlled study of configuration choices, not proof that current AI can autonomously do science.
Core intuition: an agent is a model, a harness, and its configuration
The paper uses model or backbone to mean the language model itself: it has no memory across calls and cannot act on its own. An agent wraps the model in a repeated loop: read the current state, choose an action, execute a tool, read the result, and continue or submit an answer. The harness is the infrastructure that runs the loop. It dispatches tool calls and manages the context the model sees at each step; it may also include memory or compression. The evaluated object is therefore not an isolated model but a system using a particular harness and configuration.
The study varies five axes:
| Configuration axis | What changes in the experiment | The engineering question |
|---|---|---|
| Information | From no extra guidance, to specialist identity, interface instructions, and a full task protocol | Does the agent not know a tool exists, not know how to load it, or lack the steps to use it? |
| Reasoning | No visible reasoning, reasoning discarded between steps, or reasoning retained across steps (ReAct) | Does keeping an intermediate plan in context improve later actions? |
| Verification | No check instruction, a request to check, reporting an expected score and evidence, or a binding “do not submit until convincing” instruction | Can prompting alone change what verification actually happens? |
| Budget | 5, 10, or 20 minutes of wall-clock time | Will extra time enable useful reasoning or just more unproductive tool calls? |
| Model | Three Qwen3.5 backbone sizes | Does scaling the model matter more than providing task information or changing execution? |
Information and Verification are cumulative ladders. For example, interface includes the information level that names the specialist and adds how to load and call it; protocol adds a full recipe for that particular task. Reasoning is not simply “more thinking is better”: act-only shows no reasoning, think-act generates reasoning at each step but does not retain it, and ReAct keeps it in context. These levels let us ask more precise questions: did the agent improve because it learned the tool’s name, its invocation method, or the full procedure including data preparation?
Walk one example through the method: redshift estimation
Imagine an agent receives 20 galaxy image cutouts and must predict their cosmological redshifts. The benchmark lets it read files, fetch web pages, use a terminal, write code, and run specialist models such as AstroCLIP in a prebuilt environment. The model is not exposed as a one-call answer API. The agent must identify the specialist, prepare the image input, load the model, run code, and return continuous predictions. The result is scored against spectroscopic measurements using .
The end-to-end path is:
- Receive the task. Every configuration gets the same task statement and output format. The Information axis determines how much specialist-use guidance is added.
- Choose a path. The agent must decide whether to use AstroCLIP, whether to read its README, and how to transform images into the model’s required format.
- Execute and observe. It uses file and shell tools. Errors return to the context, allowing it to revise code or inputs.
- Submit predictions. Within its time budget, the agent calls a finish tool. A run that times out before submission is incomplete; it should not be treated as an ordinary zero-score answer.
- Score and classify. The evaluator compares the predictions with the task reference, specialist-model result, and simple baseline. It also checks whether the output exceeds a task-specific margin above the trivial score, marking it as a genuine attempt.
- Repeat across configurations. Each exact configuration is run five times, then compared with other combinations of Information, Reasoning, Verification, Budget, and Model.
Likely failure points extend beyond the model’s scientific reasoning. The agent might skip image preprocessing, fetch the wrong model, call it incorrectly, or run out of time before submitting. The paper finds especially unstable results in redshift estimation: the main experiment’s completion rate is 76.3%, and among completed runs, 53.8% fail the genuine-attempt hurdle. “Completed,” “better than a trivial baseline,” and “close to the specialist” are therefore distinct states, not synonyms for a single score.
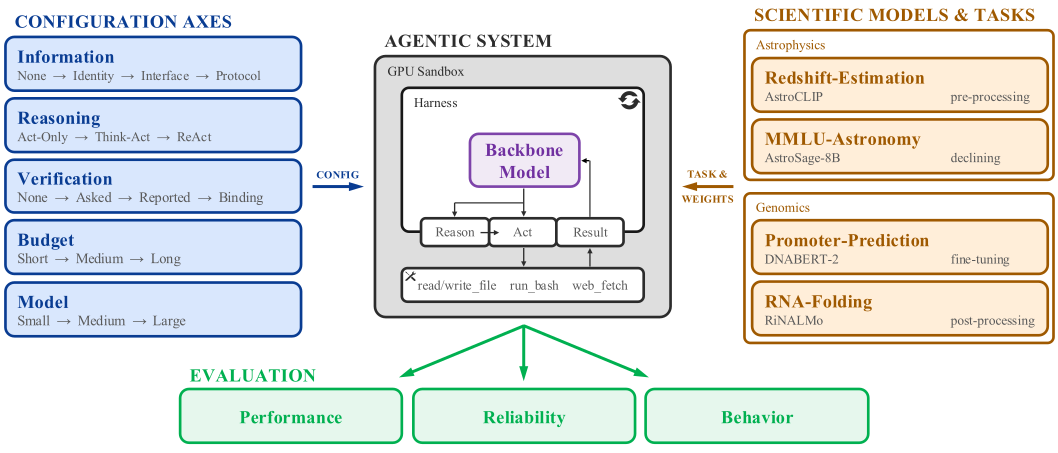
Original Figure 1, reused under CC BY 4.0. It shows the benchmark architecture—what is controlled and what the agent must operate—not that every task uses the same specialist or completes successfully. Source: arXiv v1, Figure 1.
Three metrics answer different questions: completion, genuine attempts, and gap closed
Before reading the results, separate three scores. Let be the backbone’s score when it answers directly, without the agent loop or specialist; is the specialist’s reference score reproduced by the authors in the benchmark environment; and is the agent’s score. For a gap-positive task, where the specialist outperforms the backbone, the authors define:
If , the agent has not improved on the backbone alone; if , it matches the specialist reference. Values above 1 exceed that reference; negative values are worse than the backbone. This normalization only makes sense when the specialist is stronger than the backbone. mmlu-astronomy is gap-negative: the general backbone is stronger than AstroSage, so the useful question is whether the agent can decline the weaker specialist. Gap-closed is not the right metric for that task.
A run that exhausts its time before calling the finish tool is incomplete. A completed run is not necessarily a meaningful attempt, either. The paper defines a hurdle : the score must exceed the task’s trivial score by a task-specific margin to count as a genuine attempt. The hurdle failure rate uses completed runs as its denominator, not every scheduled run. This separates “no answer,” “an answer that only reaches a trivial level,” and “at least a meaningful attempt,” before analyzing score and variance among the last group.
Method and experimental design: a configuration grid plus repeats, not one best-looking run
The main grid for the three Qwen3.5 backbones has 4 Information × 3 Reasoning × 4 Verification × 3 Budget × 3 Model levels: 432 cells. Every cell is run five times, producing 2,160 runs per task and 8,640 runs across four tasks. That is the main experiment, not all 18,240 trajectories in the paper. The remainder comes from a grid with another open-weight family, Step-3.7-Flash; a closed-model comparison with Claude Sonnet 5; and two full grids with an oracle tool. Appendix Table 4 breaks the total down as 8,640 + 1,920 + 2,880 + 2,880 + 1,920 = 18,240.
This scale has a cost. The appendix says open-weight models ran through vLLM on H100 GPUs with FP8 quantization, using one, two, or eight GPUs depending on size; Claude Sonnet 5 was accessed through an API. The paper reports estimated per-run compute/API cost, wall-clock time, tool calls, and tool errors, but those are not fixed prices that every team would pay. It is better to read the work as a cost-measurement framework than to transplant one dollar figure into another deployment.
The four tasks cover two domains, three gap-positive specialist tasks, and one gap-negative decision task:
| Task | Domain and data | Specialist | Metric | Key operation or decision |
|---|---|---|---|---|
| redshift-estimation | Astrophysics; 20 galaxy-image cutouts | AstroCLIP | Preprocess images and predict continuous redshift values | |
| mmlu-astronomy | Astrophysics; 152 multiple-choice questions | AstroSage-8B | Accuracy | The specialist is weaker than the backbone; the agent should consider answering directly |
| promoter-prediction | Genomics; 613 human DNA sequences | DNABERT-2 | Matthews correlation coefficient (MCC) | Locate, preprocess, fine-tune, then operate the model |
| rna-folding | Genomics; 300 RNA sequences | RiNALMo | Structure-level pairing F1 | Predict contacts, then post-process them into valid secondary structures |
One fixed strategy cannot fit all four tasks. Some require finding and using a stronger specialist, some require fine-tuning, and in one case the correct behavior may be to ignore a specialist that has fallen behind. This is why the benchmark scores the agent’s discovery and operation of the model, not just its final text response.
Finding 1: repeat-run noise can swamp configuration differences
Figure 2 separates within-cell repeat variation from differences between configuration cells. If all completed runs are included, configuration differences explain about 39.4% of variance. Some runs submit but do not clear the genuine-attempt hurdle; a small number of very poor outputs can inflate within-cell variance. The authors therefore also analyze only hurdle-clearing attempts. In that subset, configuration differences explain 46.1%, leaving about 53.9%—rounded to approximately 54% in the abstract—attributable to repeating the same configuration.
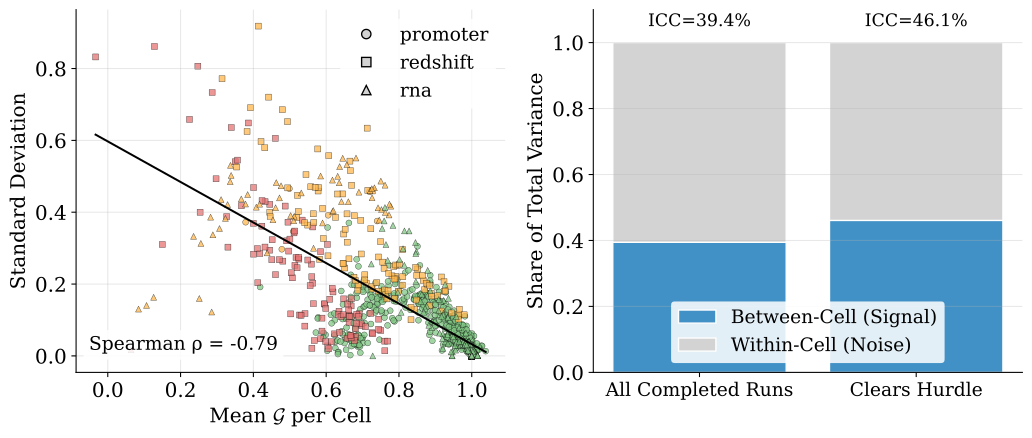
Original Figure 2, reused under CC BY 4.0. The 54% refers to a variance decomposition on hurdle-clearing runs from three gap-positive tasks after removing task means; it does not mean every agent task is “54% random.” The left panel shows lower standard deviation in higher-scoring cells, so quality and consistency may move together. Source: arXiv v1, Figure 2 and Appendix A.3.
Completion itself also varies. Across four tasks, 80.7% of runs finish and 19.3% time out without submission. In the main grid, RNA folding completes only 61.7% of runs and redshift estimation 76.3%. For some configuration cells, all five repeats complete, some complete, or none complete. Appendix Figure 5 plots the number of completions per cell and the half-width of 95% confidence intervals. It warns that a single run cannot estimate reliability; even five repeats leave wide intervals for some cells.
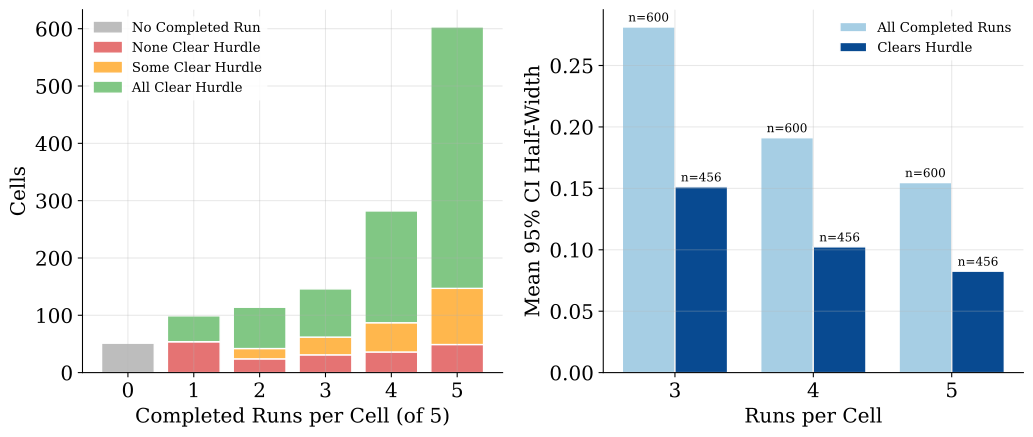
Original Appendix Figure 5, reused under CC BY 4.0. The left panel counts how many of five runs per cell complete across three gap-positive tasks; the right compares the mean 95% CI half-width with and without the hurdle filter. The figure does not show that five runs are sufficient—it shows why completion and uncertainty belong alongside scores. Source: arXiv v1, Appendix A.4, Figure 5.
What the numbers do and do not tell us
| Question | Paper observation | Interpretive boundary |
|---|---|---|
| Did the agent submit? | Completion ranges from about 61.7% to 95.3% by task; overall it is 80.7% | Completion is not the same as beating a simple baseline or matching the specialist |
| Are genuine attempts consistent? | After pooling the three gap-positive tasks, about 54% of score variance among hurdle-clearing runs is same-cell repeat noise | A single run cannot show that configuration A reliably beats configuration B |
| Which tasks are especially unstable? | Redshift’s completed-run hurdle failure is about 53.8% and outcome consistency 0.727; promoter-prediction’s failure is about 0.5% and consistency 0.986 | Reliability depends on the task; the mean should not be copied to every workload |
| Are five repeats enough? | Some cells still have wide 95% confidence intervals | Choose repeats and uncertainty reporting for the decision risk and expected effect; do not treat five as a universal standard |
The paper’s treatment of run-to-run noise is careful, but 54% is not a law of agent evaluation. It depends on the tasks, hurdle definition, selected configurations, and pooling procedure. The hurdle determines which runs enter the subset, and the appendix includes a sensitivity analysis for its margin. Teams comparing agents should keep incomplete and below-hurdle runs rather than selecting only those that produce appealing scores.
Finding 2: information is often the first lever to test
The authors define an axis effect as the range of that axis’s mean across levels, normalized by within-cell standard deviation. This is an effect-size ranking, not a causal estimate or a universal percentage-point gain. In Table 3, Information ranks first across the three gap-positive tasks; its mean rank is 1.00, versus 2.67 for Model, 3.00 for Reasoning, 3.33 for Budget, and 5.00 for Verification. In 1,000 bootstrap resamples, Information remains first in at least 99% of samples.
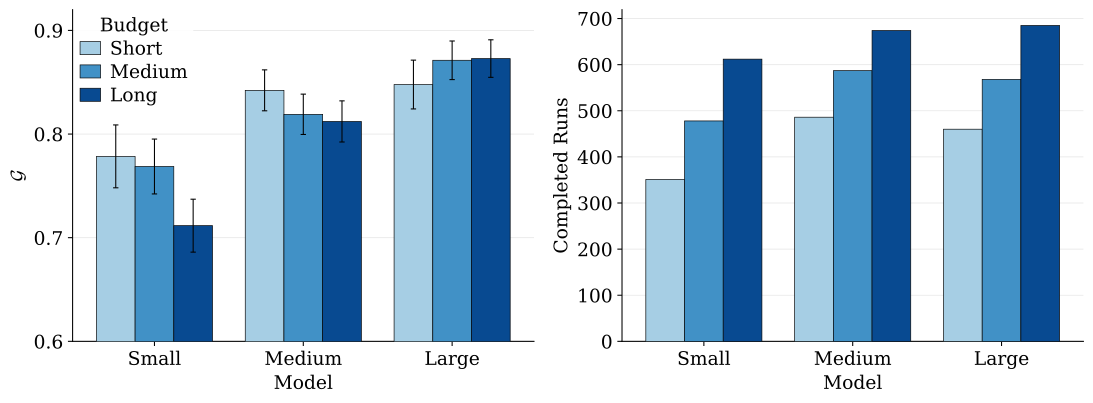
Original Figure 3(a), reused under CC BY 4.0. It compares gap-closed and the number of completed runs across Model × Budget combinations, with 95% confidence intervals; it illustrates an interaction, not that more time is useless. Source: arXiv v1, Figure 3(a), Section 4.2.
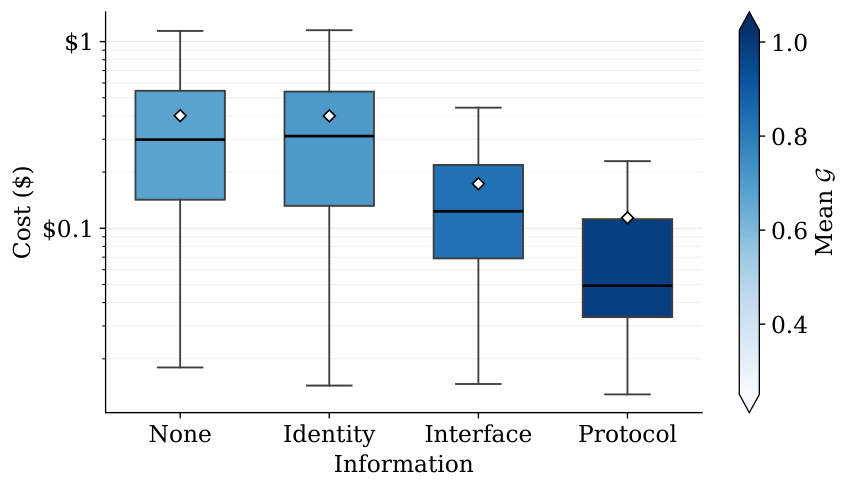
Original Figure 3(b), reused under CC BY 4.0. It plots cost distributions by Information level alongside mean . Costs are estimated by the authors; hardware, model prices, prompt caching, and deployment conditions can change actual spend. Source: arXiv v1, Figure 3(b).
The Information ladder is more nuanced than pasting a paper into a prompt. It adds, in order: the identity of the specialist; its interface, including how to load and call it; and finally a task-specific protocol with a complete operating recipe. This distinguishes whether the agent fails because it does not know the model exists, cannot use it, or lacks the right data preparation and procedure. In Figure 3(b), more information coincides with higher average and lower cost. The authors also report that protocol-level information lowers runtime and calibration error. This does not mean information is free or every task can be fully specified in advance. It suggests that unguided exploration may be slower, more expensive, and less effective than giving the agent enough context to act.
More time is not an automatic capability multiplier
The useful reading of Figure 3(a) is not “small models should never receive more time.” It is “time amplifies a system’s existing direction.” In the pooled analysis of three gap-positive tasks, extra budget can raise both completion and gap-closed for the large backbone. For small and medium models, it can raise completion while lowering mean . The appendix’s redshift × Information × Budget analysis is more specific: at the none information level, mean falls from -0.429 with a short budget to -0.713 with a long budget. At the protocol level, mean is 0.753 under all three budgets. This is a result for this benchmark, not proof that 20 minutes is generally worse than five; it illustrates how an under-informed agent may spend more time continuing an unproductive approach.
Information and backbone also interact. More time may be worthwhile for a capable model, while extending the budget for a weaker model may not help. Interface instructions or a task protocol may let the same time produce useful actions. For engineering, this means testing interactions, not using an average one-factor ranking to set production configuration. A practical experiment should record completion, hurdle rate, quality, token/API cost, wall time, and repeat variance under the same workload and versions before changing one axis at a time.
Finding 3: asking for verification is not the same as building a verifier
Verification ranks last among the five axes by score effect. When the authors strengthen the prompt from “do not check” to “do not submit until you are convinced,” reference-based verification rises only from 19% to 22%. About three-quarters of runs check only their answer’s format, not whether it matches an external reference. Asked “did you check?”, an agent may inspect a JSON field or reread its own work—not establish correctness.
The authors then provide a system-level oracle tool. At any point, the agent can compare its current submission with the benchmark’s reference answer. This raises scores for both tested backbones on every task and sharply reduces calibration error. Reference-based verification becomes roughly three times as common. There is a cost: more tool calls increase runtime and spending in every comparison. The authors also check whether agents repeatedly query the oracle to hill-climb toward an answer; this happens in 4.4% of runs, and removing those runs barely changes the results.
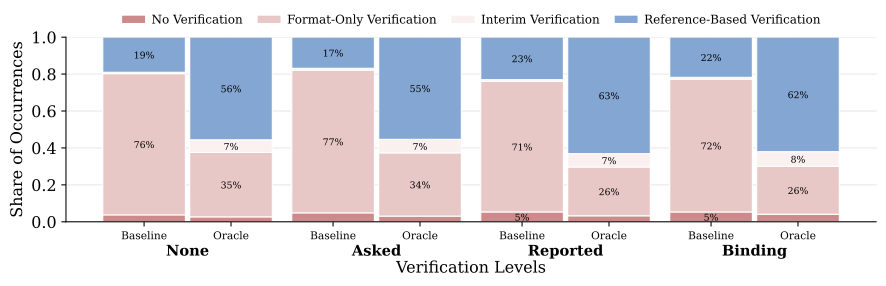
Original Figure 4, reused under CC BY 4.0. Categories come from trajectory analysis. When the oracle is added, some increase naturally comes from oracle calls themselves; it should not all be read as the agent becoming intrinsically more cautious. Source: arXiv v1, Figure 4, Sections 4.3–5.
This supports a limited but useful design recommendation: if correctness matters, do not rely only on a system prompt saying “check carefully.” Provide a test, reference sample, schema, sandbox, or task-specific verifier so that the desired behavior is an available system capability. But the paper directly studies only verification; it cannot establish that system tools solve every behavior—such as safety, refusal, citations, or preference following.
A diagnostic counterexample: agents may not reject a weaker specialist
The mmlu-astronomy task is gap-negative. AstroSage-8B has a reference accuracy of 0.671, while the backbone alone scores 0.967. A rational strategy would avoid the weaker specialist. Yet 99.8% of runs use AstroSage, and mean accuracy is 0.685—close to the specialist and far below the backbone. Even with an oracle, overall performance does not improve substantially.
The authors suggest possible explanations: agents may assume that a specialist is necessarily better, or they may explore too little to compare against the backbone’s own answer. These are hypotheses for future work, not causal mechanisms identified by the paper. The result still exposes an important benchmark-design point: listing a tool and successfully calling it do not make tool use beneficial. Evaluations should include tasks where the specialist is helpful, where it must be fine-tuned, and where it should be rejected because it has been surpassed. Otherwise, an agent may learn the superficial rule “if a model is available, call it.”
Additional diagnostics: settings do not transfer unchanged across models
The authors add Step-3.7-Flash as another open-weight model family and Claude Sonnet 5 as a closed API comparison. Both open-weight models rank Information first, but Claude Sonnet 5 produces a different ranking: Budget becomes its strongest axis, with Information second. “Information matters more than budget” is therefore the overall result in the main experiment and open-weight comparison, not a rule fixed across all backbones. A deployment team should retest against its actual model and tools.
Sonnet 5 makes fewer tool calls than Qwen-397B-A17B, has about one-fifth as many tool-call errors, and is better calibrated. Yet at list prices, it costs more and has a lower pooled . Efficiency, error count, per-task cost, and task quality are separate dimensions; none can be compressed into a statement that one model is simply “smarter.” Prices change with caching, provider rates, and hardware, so the estimates belong to this experimental setup, not a procurement quote.
The authors also classify behavior across 18,240 trajectories. First, a DeepSeek-V4-Flash-0731 judge describes six dimensions for each trace: overall outcome, root error, specialist use, verification, planning and exploration, and execution quality. Sentence-BERT embeddings and HDBSCAN then cluster these descriptions; a judge helps name and merge categories. This makes it possible to move from a score to patterns in how agents fail. It remains judge-based trajectory analysis, not a ground-truth annotation set independently reviewed by domain experts. The taxonomy can suggest patterns, but should not be treated as an error-free diagnosis of an agent’s internal state.
Evidence map: supported claims and open questions
| Claim | Evidence in the paper | What it supports | What it does not establish |
|---|---|---|---|
| One agent run can be unstable | Figure 2, Appendix Figure 5; five repeats per cell, hurdles, and variance decomposition | These four tasks warrant reporting repeats, completion, and uncertainty; one run is not enough for a reliable ranking | That every real agent task has exactly 54% variance, or that five repeats are generally enough |
| More task information helps | Table 3 and bootstrap analysis; Information ranks first on three gap-positive tasks | In this benchmark, task procedures and interface information are a high-priority lever to test before scaling the backbone | That information always beats model capability or has the same effect in every domain |
| Time interacts with model and information | Figure 3(a), Appendix Figure 6, and Table 9 | Whether more budget helps depends on whether the agent knows what to do and can use the time | That extra time always reduces quality when information is missing, or is always useless |
| A system verifier beats a reminder alone | Figure 4, Section 4.3, and Appendix Table 12 | For these tasks and two models, the oracle changes reference-checking behavior and outcomes, at added cost and runtime | That any automatic verifier ensures correctness, or that system-level design has been tested for all behaviors |
| An agent may fail to reject a weak tool | mmlu-astronomy specialist and backbone accuracy, plus 99.8% specialist-use rate | In this benchmark, most runs did not decline the weaker specialist | That all agents blindly follow specialists, or that the result proves a particular authority-bias mechanism |
Artifacts and reproducibility: traces are linked; the complete runner is still pending
As of October 3, 2026, the arXiv v1 is public. The GitHub repository exists, but its README says the full code and benchmark are coming soon; it also links to the agentic-science-trajectories dataset on Hugging Face. The paper’s promised 18,240 trajectories and produced artifacts are distinct from a complete benchmark runner. Readers can explore the paper, README, and linked dataset, but should not assume that the current repository provides a one-command reconstruction of every model environment, specialist installation, GPU configuration, oracle experiment, and analysis.
This article did not install models, run the benchmark, or reanalyze all trajectories. All experimental values remain author-reported, and no independent reproduction was found. The authors say full code and instructions will be released. Before attempting reproduction, confirm whether the repository later adds the runner, benchmark tasks, preprocessing scripts, dependency versions, hardware guidance, and oracle configuration. Record the reproduction scope component by component. Access to traces can support some behavioral analyses; it is not the same as rerunning the experiments from scratch.
Limitations and alternative explanations
- Limited task coverage. Four tasks across two scientific domains focus on operating specialist models. General coding agents, RAG, browser agents, long-term memory, multi-agent coordination, and real researcher workflows are not tested.
- Researchers define tasks and procedures. Tasks, information protocols, hurdle margins, and reference scores must be made explicit. Different tasks, data difficulty, or specialist quality could change the ranking of configuration axes.
- Completion and score involve distinct denominators. Only submitted runs receive scores; gap-closed exists only when the specialist exceeds the backbone; genuine attempts are then selected with a hurdle. These subsets must not be conflated.
- Repeat counts remain modest. Each cell is run five times, and the authors note that some confidence intervals remain wide. The 54% estimate can depend on pooling, hurdle choice, and which runs complete.
- Axis rankings can change by model family. Qwen/Step and Claude Sonnet do not share the exact ordering. Cross-model findings are a reason to retest, not to declare a fixed best practice.
- Behavior labels are not causal explanations. LLM judging and clustering can scale trace analysis, but results may depend on extraction prompts, embeddings, and category labels. The authors do not claim that this is a human-calibrated, universal taxonomy of agent psychology.
- Data access does not make computation cheap. Multiple large models, GPUs, API prices, and specialist environments affect the speed and cost of an independent rerun. Public traces lower the barrier to behavior analysis but do not substitute for the runner.
Bloss0m engineering judgment: include stability and “when not to use an agent” in acceptance
The lesson worth adopting is not “write every protocol into the prompt.” It is that evaluation should measure multiple layers. Replacing one single-run success rate with another does not fix run-to-run noise. For an expensive or risky workflow, track at least:
- completion rate and timeouts, rather than treating missing submissions as ordinary wrong answers;
- the share that clears a trivial baseline or task-specific acceptance gate;
- quality scores with confidence intervals or repeated-run variance;
- verifier coverage, reference-based checks, false accepts, and false rejects;
- mean and tail cost, wall-clock time, tool calls, and tool errors;
- the agent’s ability to decline a low-quality specialist, fall back to its backbone, or escalate to a person.
These are deployment recommendations synthesized from the paper, not a complete standard validated by its authors in enterprise systems. When not to apply this directly: if a task has no trusted acceptance answer, inputs change daily, an oracle would leak the correct answer, or a high-stakes decision requires expertise the model does not have, the paper’s measurement setup cannot simply be copied. In particular, the experimental oracle can see a benchmark reference. A production system may have only an incomplete validation set; it should not present that weaker verifier as an equivalent guarantee.
To turn the idea into a team experiment, choose a task with an acceptable reference answer and fix the data, tool versions, hardware, and budget. Repeat the baseline, change Information or Verification separately, then add selected Budget × Model conditions. Define completion, the minimum acceptable score, and failure categories before running. Report numerators, denominators, intervals, and resource use. If a new setting improves completion but not quality—or raises mean score while making failures less predictable—the team can see the trade-off instead of being drawn to the highest score.
Three things to remember
- Technical idea: Agent capability is the combination of a backbone, harness, task information, tools, and resource configuration. Evaluate the system, not just the model name.
- Evidence: Across these four AI-for-science tasks, Information ranks first by measured effect; valid repeat attempts still show about 54% same-configuration score variance, and prompted self-verification barely increases reference checking.
- Adoption boundary: These are author-reported findings from four controlled specialist-model workflows, not universal agent laws. The full benchmark runner is not yet released, and no independent rerun was found.
Primary sources
- Wiedmann, Luis; Girrbach, Leander; Schmid, Cordelia; Akata, Zeynep. “Agents are systems, not models: Rethinking agentic evaluation”, arXiv:2610.01618v1, submitted October 1, 2026. Full text and Figures 1–5, licensed CC BY 4.0.
- Authors’ public repository and linked agentic-science-trajectories dataset. The README’s release status is summarized as of October 3, 2026.