This reading follows arXiv v1 of the full paper and the author-linked swe-agent-subset-selection replication repository. The v1 contains Sections 1–9 and References, with no separate appendix headings. The paper was submitted on 2026-09-21; this article is pinned to the v1 visible on 2026-09-24. It is a preprint, not evidence of peer review or a final publication. This is an empirical benchmark and evaluation study: the authors do not propose a new agent, but investigate how to estimate a software engineering agent’s resolve rate on a full benchmark more cheaply during development.
The paper in 90 seconds
- Problem: After changing a model, prompt, or agent framework, teams want to know whether regression-test performance improved or declined. Running every SWE benchmark instance after every iteration is expensive. A small random sample costs less but may be much harder or easier than the complete suite, making its resolve-rate estimate unstable.
- Core insight: First stratify instances by pass counts from prior full runs, preserving the historical outcome mix. Then, within each stratum, use geometric selection over embeddings of sanitized prior agent trajectories. Outcome strata preserve difficulty composition; embeddings help choose behaviorally representative instances within each stratum.
- Strongest evidence: The paper compares 76 subset-selection configurations using 31,779 trajectories from 58 runs across five agent frameworks in three regression scenarios, with temporal cross-validation. At 10%, Centroid Pooled has median RMSEs of 0.0431 and 0.0400 on Multi-model and Multi-agent. The cost experiment estimates that average token use falls roughly in proportion to subset size, from 3.44B to about 345M tokens for a 10% subset.
- Main boundary: Evidence is from software repair agents on SWE-Rebench and SWE-Bench Verified, not arbitrary agent tasks. Results vary across configurations and subset sizes; stale trajectories, distribution change, incomplete sanitization, or cross-task transfer can make the selected set unrepresentative.
Core engineering takeaway: The useful message is not that 10% is always enough. The paper separates two sources of subset distortion: preserving the historical difficulty mix and reducing within-stratum behavioral selection error. Trajectory features help in the evaluated SWE regression setting, but the reported gains vary by scenario, method, and subset size. A small subset can provide a frequent early signal; it cannot replace periodic full evaluation.
Why previous approaches fall short: which full-run quantity should the subset estimate?
In an SWE-agent benchmark, an instance is usually a GitHub issue in an existing repository. The agent reads code, calls tools, edits files, runs tests, and is scored as a pass or fail depending on whether it resolves the issue. The resolve rate is the fraction of resolved instances. Developers want this measurement after each agent update, but every issue entails a full loop of model calls, tools, and test execution. Re-running the whole benchmark for every CI iteration consumes substantial time and tokens.
The paper’s target is a fixed subset, built from earlier full runs, whose resolve rate on a later run estimates the resolve rate on all instances in the same benchmark. It does not propose a test ordering that maximizes the chance of finding a new bug early. Nor does it select a static set for preserving a ranking across multiple models. The target quantity is one agent’s full-benchmark resolve rate across successive updates.
The weakness of uniform random sampling is not only its average error. A small subset can accidentally omit important difficult behaviors, creating a long tail of large errors. Repository proportions are also an imperfect proxy: issues from one repository can pose very different problems to an agent. Historical pass/fail grouping controls outcome composition, but one outcome group can still contain different patterns of debugging, editing, testing, and error handling. The authors add past trajectories as a second signal ( Introduction, Section 1; Background, Section 2.2 ).
Core intuition: preserve difficulty proportions, then find typical behavior within each group
Historical pass counts and trajectory vectors serve different purposes. If 60% of benchmark issues have always passed in prior runs, the subset should preserve about that share; otherwise its resolve rate will be skewed toward easy or difficult cases. Within each outcome group, the method then selects instances that are typical in trajectory-embedding space, instead of relying on a random draw that may select a narrow behavioral slice by chance.
This division clarifies why common alternatives are limited:
- Uniform Random uses no history; both subset composition and within-group selection are left to chance.
- Repository Stratified preserves repository proportions, but repository identity is not agent difficulty.
- Difficulty Stratified splits instances into easy and hard using the majority outcome across prior runs. Consistency Stratified creates a group for each exact pass count, distinguishing an instance that usually passes from one that passes inconsistently.
- Pure trajectory clustering finds groups of behaviorally similar instances, but similar behavior does not imply the same resolve probability. Clusters can mix easy and difficult issues.
The paper’s proposal is therefore the combination of outcome grouping and trajectory geometry, not an embedding that replaces outcome stratification ( Approach, Sections 4.3–4.4 ).
Walk one example through the method: three full runs and a future estimate
The following is an explanatory example constructed from the method description, not additional experimental data. Imagine a benchmark with 1,000 issues and three completed full runs. Each issue passed once, twice, or three times in those runs.
- Input: Three chronological full-run results and an agent trajectory for each issue and run, including model thoughts, tool actions, and observations.
- Normalize the representation: Parse different framework log formats, such as OpenHands’ flat message sequence and Moatless’s search tree, into a shared JSON schema with comparable steps, actions, and observations ( Figure 3 / Section 4.1 ).
- Remove leakage and embed: Remove or mask cues such as “tests passed,” exit codes, repository names, and test-harness tokens that could reveal the outcome or task identity directly. Then embed each sanitized step’s action and observation.
- Group and select: Put issues into four groups according to whether they passed zero, one, two, or three times. Allocate subset slots in proportion to each group’s share of the full benchmark. In each group, choose the issues whose embeddings are closest to the group’s centroid until the requested subset size is filled.
- Test later and measure error: After the model or setup changes, evaluate the subset. Compare its resolve rate with the full-benchmark resolve rate on that same future run. If prior trajectories no longer resemble the new agent’s behavior, or the agent has changed substantially, the fixed subset may miss new failure patterns; a later full run is needed to refresh it.
The path is past full-run outcomes + sanitized trajectories → historical strata + embeddings → fixed subset → later unseen run → subset/full resolve-rate gap. Leakage removal is a condition for a meaningful selection signal, not an optional cleanup after selection.
Mechanism: sanitizing and embedding the trajectory
Four phases of trajectory sanitization
The authors first parse each framework’s raw logs into a common representation, then use a four-phase sanitization pipeline ( Approach, Section 4.2 ):
- Discover corpus-specific noise: Scan tokens across the corpus. Letter/digit patterns flag UUIDs, commit hashes, random seeds, and temporary paths that change nearly every time; frequency analysis flags repetitive boilerplate. Researchers review candidates once per dataset and encode rules.
- Detect outcome and identity leakage: Identify outcome words, exit codes, repository names, repository-specific tools and strings, and test-harness artifacts. The first group can reveal pass/fail directly; the rest can cluster embeddings by repository or tooling rather than agent behavior.
- Clean and mask: Remove generic boilerplate and explicit leakage terms. Replace identifiers with typed placeholders such as
[PATH]and[RANDOM_SEED], preserving the presence of a path or random value while removing its identity. - Validate: Use TF-IDF with logistic regression to see which words predict outcomes before and after sanitization. Accuracy does not fall substantially (68.9% raw to 65.7% sanitized on Single-setup; it even rises slightly on the other two datasets), but the strongest terms shift from
passedand repository tokens to task-related language such asscopeandhypothesis. A scan of 200 sanitized trajectories per dataset found no remaining flagged words.
These checks support the claim that explicit outcome and repository cues were addressed. They do not show that outcome became impossible to predict: task-related words still predict pass/fail at 65.7–80.3% accuracy. The authors acknowledge the remaining correlation with task content. Sanitization also requires dataset-specific calibration, so the same stop-word list should not be copied blindly to a new benchmark.
Two embedding variants and five geometric selection algorithms
The authors encode each trajectory step’s sanitized action and observation with Nomic Embed v1.5, producing a 768-dimensional vector. Its 8,192-token context window can hold long tracebacks. Other parsed fields, such as files_touched and edit_size, are not included in this text embedding.
- Pooled embedding: Compute a 768-dimensional mean and standard deviation over step vectors to capture central semantics and variation across steps. Concatenate those with vectors for the first, middle, and last steps to produce a 5 × 768 = 3,840-dimensional representation. This includes a few temporal anchors but not the full event order.
- Time-series embedding: Keep the full T × 768 step sequence, preserving action order more completely, at greater comparison and selection cost. In the results, it does not consistently outperform pooled embeddings.
Geometric selection runs within the outcome strata described above. Centroid chooses instances closest to the mean embedding in the group. Facility Location adds the instance that most improves total similarity between the selected set and all remaining instances. Medoid starts with a real instance minimizing total distance, then expands coverage. Kennard–Stone repeatedly chooses an instance farthest from those already selected to increase diversity. Core/Edge allocates 90% of a group’s quota to centroid-near typical cases and 10% to Kennard–Stone-style edge cases. Given the same past runs, embeddings, and subset size, these rules are deterministic ( Section 4.4.2 ).
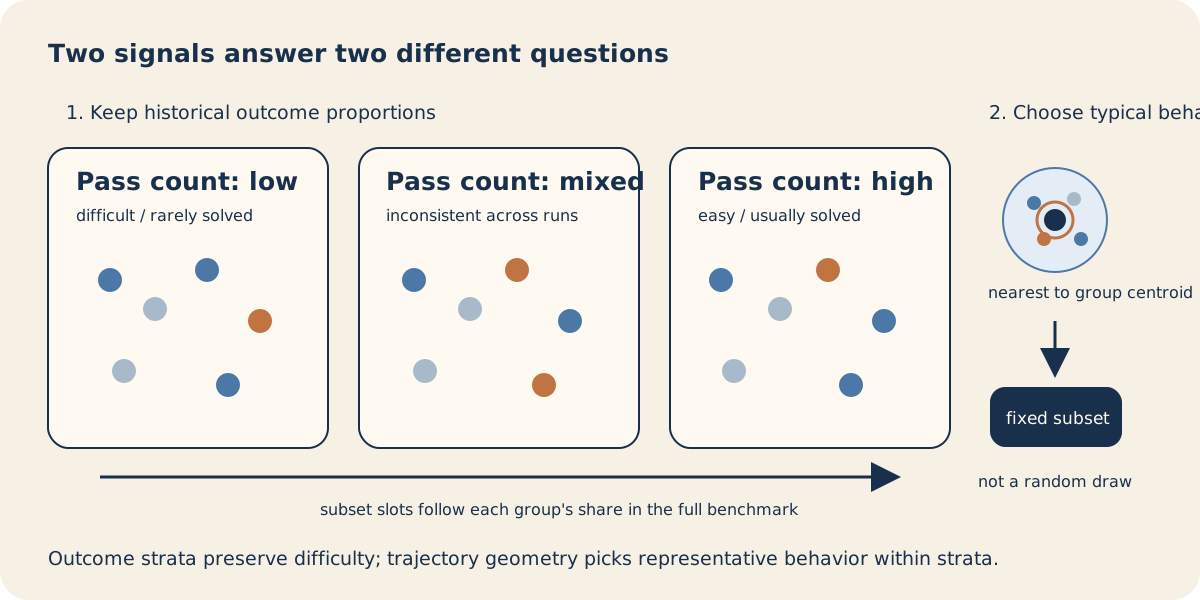
Original explanatory diagram, not a paper figure: the diagram uses three abstract groups to explain outcome-stratified sampling and embedding-within-strata selection; the actual number of strata depends on available historical pass counts, and the image does not imply a fixed count of three. Historical pass-count strata preserve each group’s share; centroid selection is only one geometric method within a stratum. Related source: paper Figure 3 and Section 4. The authors have not granted explicit permission to reuse the original figures; arXiv v1 lists only the perpetual non-exclusive distribution license, so this is not a reproduction. Figure 3 / Section 4 · arXiv license information.
Evaluation design: three kinds of change, with past-only selection
The study uses 31,779 publicly available trajectories across 58 runs and five agent frameworks, divided into three scenarios ( Evaluation Setup, Section 5.1 ):
| Scenario | Data | What it tests |
|---|---|---|
| Single-setup | OpenHands + Qwen3-Coder on SWE-Rebench: 3,188 instances, 25,279 trajectories, 45 runs | Repeated runs of the same setup, mainly model stochasticity |
| Multi-model | OpenHands with different models or run settings on 500 SWE-Bench Verified instances × 6 runs = 3,000 trajectories | Changes to foundation model, inference settings, or iteration limits |
| Multi-agent | OpenHands, Moatless, Lingxi, Trae, and Refact on 500 SWE-Bench Verified instances × 7 runs = 3,500 trajectories | Framework and problem-solving changes; a larger transfer shift |
The first two settings resemble recurring agent updates; Multi-agent is a harder transfer condition. For Multi-model and Multi-agent, the authors also sample 1,000 synthetic 250-instance distributions from a pool of 500 source issues, spread across nine resolve-rate difficulty levels from 10% to 90%. Single-setup has enough empirical reruns that the same synthetic generation step is not used.
Temporal cross-validation orders runs chronologically. For each window size , the authors enumerate usable combinations of prior runs. Only these past runs may define outcome groups, embeddings, and the selected subset; evaluation uses a later run not seen during selection. Runs before or between training runs are not used as the test for that split. For Multi-model with and , ten usable splits remain. This enumeration deliberately stresses different history windows; some combinations are non-contiguous and may be older than a realistic deployment history ( Table 2 / Section 5.2.2 ).
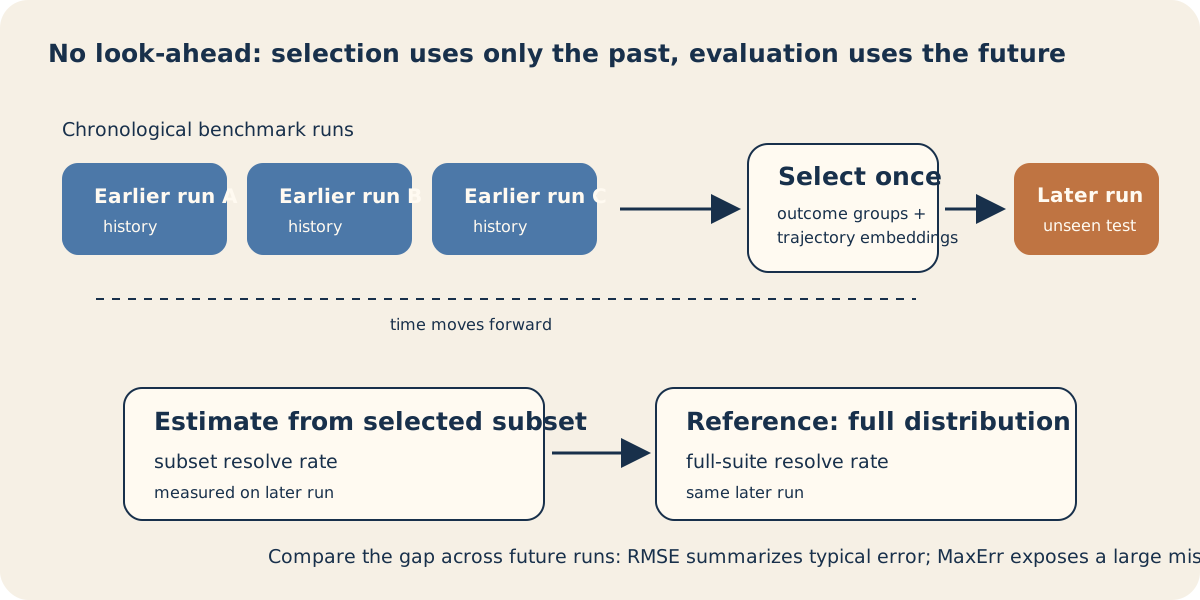
Original explanatory diagram, not a paper figure: past runs create the selection state, and later runs measure estimation error; this temporal separation prevents selection from seeing future outcomes. Related source: paper Figure 4 and Section 5.2.2. The authors grant no explicit reuse license for the original figures; arXiv v1 lists a perpetual non-exclusive distribution license, so this image is independently drawn. Figure 4 / Section 5.2 · arXiv license information.
The main metric RMSE captures the overall gap between the subset resolve rate and the actual rate over the full instance pool. MaxErr records the largest gap for that subset on any one unseen run, surfacing a severe miss rather than an average. Each stochastic baseline runs with 500 seeds per synthetic distribution and temporal split; results include median, P95, and worst per-seed MaxErr. Comparisons use paired Wilcoxon signed-rank tests with Holm–Bonferroni correction by comparison family, and report Cliff’s delta; p-values alone are not treated as practical effect size. The 1,000 synthetic distributions overlap, and the authors acknowledge that dependence may make Wilcoxon p-values optimistic. They supplement the analysis with effect sizes and robustness checks by difficulty level ( Sections 5.3–5.4 and 8.4 ).
Result 1: historical outcomes are a strong baseline, but random picks still have a long tail
Among six baselines, Consistency Stratification (Consist-Strat) is strongest overall: it groups instances by the exact number of passes in prior runs and then samples proportionally at random. Compared with Uniform Random, it reduces median RMSE by 51% on Single-setup, 31–32% on Multi-model, and 40–42% on Multi-agent. Repository stratification provides little improvement, generally under 2%. Prior outcome history is therefore a more useful difficulty signal for this task than repository identity ( Table 3 / Section 6.1 ).
Yet average error does not show the full risk. At a 5% subset size, Consist-Strat has a typical-draw MaxErr of about 14%, with the worst seed reaching 31–35%. Even at 30%, the worst seed still produces about 10–11% error. This is why the paper does not stop at “stratified sampling is good enough”: a developer may incorrectly roll back a valid change after an underestimated subset rate, or miss a real regression after an overestimate. Long-tail error can change the decision.
Result 2: trajectory geometry helps in some settings, not everywhere
Centroid Pooled is among the stronger trajectory-aware configurations across several subset sizes and datasets, but the gain depends on scenario. At 10% on Multi-model, its median RMSE falls from 0.0498 with Consist-Strat to 0.0431 (an 11.4% relative reduction; , Cliff’s ). On Multi-agent it falls from 0.0422 to 0.0400 (a 3.1% reduction). The effect is not the same size. Centroid Pooled improves both datasets at 5%, but at 20% and 30% some methods and datasets favor the baseline instead. The label “trajectory-aware” cannot replace reading results by condition ( Table 5 / Section 6.2 ).
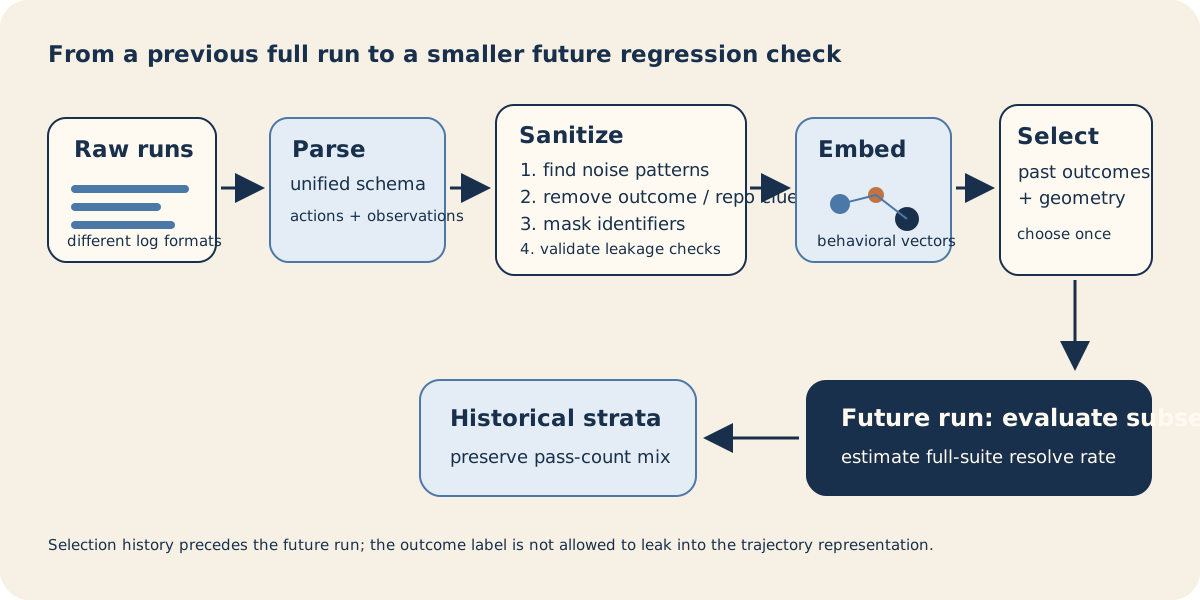
Original explanatory diagram, not a paper figure: this image shows parsing, four-stage sanitization, step embeddings, historical outcome strata, selection, and a later-run estimate; it does not encode experimental measurements. Related source: paper Figure 2 and Sections 4.1–4.4. The original paper figure has no explicit reuse grant; arXiv v1 lists only a perpetual non-exclusive distribution license, so this is a separately drawn explanatory diagram. Figure 2 / Section 4 · arXiv license information.
The worst-case metric also improves, but the comparison level matters. At 5% and 10%, Centroid Pooled lowers MaxErr by about 4–11% relative to a typical draw from the strongest baseline, and by 38–46% relative to its P95 draw. At 10%, the baseline’s typical-draw worst error is about 10 percentage points and its P95 draw is about 15–16 points, versus roughly 9 points for Centroid Pooled. The comparison does not use the highest result across all 500 baseline seeds against the deterministic method; it follows the paper’s median/P95/worst per-seed reporting levels ( Table 6 / Figure 6 ).
Why are both outcome grouping and geometry needed?
The 76 configurations vary design choices including six random or stratified baselines, two trajectory embedding types (pooled and time-series), geometric selection algorithms, candidate shortlists, clustering families, and the use or removal of outcome grouping. The ablation finds outcome grouping matters: removing it raises RMSE by 36.7% on Multi-model and 30.5% on Multi-agent. Clustering instances by behavior also cannot replace outcome groups: the best clustering configuration still has RMSE 15.7% higher on Multi-model and 9.0% higher on Multi-agent than Centroid Pooled. Behaviorally similar instances can have different pass probabilities, mixing easy and hard tasks.
Randomly sampling after a geometric shortlist is also worse than selecting deterministically from the embedding space: the best shortlist configuration has RMSE 20.8% higher on Multi-model and 25.5% higher on Multi-agent. A fixed selection control that ignores trajectories does not fully reproduce the centroid’s gains either. Together, these ablations support the authors’ mechanism interpretation: historical outcomes control difficulty composition, and geometry chooses behaviorally representative examples within each group. They do not prove these are the only useful components for every agent benchmark ( Table 7 / Figure 7 / Section 6.3 ).
Two findings complicate a simple “more trajectory detail is better” story. First, pooled embeddings match or outperform time-series embeddings in most reported configurations, so preserving every step in order does not provide a universal gain. Second, the subset size and scenario affect the winner: Centroid’s 10% gain is larger on Multi-model than Multi-agent, while some 20% or 30% rows favor Consist-Strat or another method. The headline median error below 5% summarizes the best 10% method; it does not mean every single split is within 5%.
Token cost: 90% is an average expectation, not an exact saving on every run
The cost analysis uses 3,000 trajectories from six OpenHands Multi-model runs. For each run, the authors draw 10,000 random subsets and compute token use relative to the full run. Instance costs vary by up to 492×, so an individual subset may be substantially above or below its expected share; for a 10% random subset, the widest reported middle 95% range is 5.7–15.0%. Centroid Pooled’s 10% subset consumes 10.48% of full-run tokens averaged across temporal splits, inside that random range, showing no detected preference for cheaper or more expensive instances. The authors report a reduction from about 3.44B to 345M tokens, a 90% average saving ( Table 9 / Section 6.4 ).
This is a reduction in agent-run token cost after selecting 10% of the benchmark instances. It does not include all organizational costs such as initial dataset sanitization, embedding generation, vector downloads, or maintaining full evaluation coverage. Nor does it mean the whole development process always becomes 90% cheaper. A subset that happens to contain unusually expensive tasks can cost more than the average share.
The 76 configurations and where selection can fail
The paper’s 76 refers to subset-selection configurations, not 76 independent benchmarks or 76 agents. The families include classic baselines, geometric selection within outcome strata, pure embedding approaches, clustering by trajectories or simple trajectory features, and shortlist hybrids. Common comparisons evaluate four subset sizes (5%, 10%, 20%, 30%). When interpreting a best row, retain its scenario, history window, embedding family, and subset size; one strongest result does not represent all combinations.
The paper and its results identify several conditions where the method may fail or degrade:
- Stale history or a large agent change: The subset is fixed from past runs. Model, tools, prompt, or framework changes may make old trajectories unrepresentative. Multi-agent transfer is a harder setting, not proof that a historical subset never needs refreshing.
- Outcome-only or behavior-only selection: Keeping the pass-count mix still leaves a long tail from random within-stratum sampling. Clustering behavior alone can mix instances with different difficulty and pass rates.
- Residual task signal after cleaning: A classifier still predicts outcomes with 65.7–80.3% accuracy after sanitization. The pipeline removes explicit indicators, not every correlation between task content and outcome. A new corpus needs its own calibration and validation.
- Temporal representations are not a free improvement: Pooled embeddings ignore exact action order; time-series embeddings preserve it, but the study does not find that they are systematically better. Order-sensitive representations need benchmark-specific validation.
- Maximum error is not every kind of safety or quality: RMSE and MaxErr measure resolve-rate estimation. They do not replace coverage of new issue types, failure-mode recall, regression detection power, or model ranking.
- Dependence among validation distributions: The synthetic distributions are sampled from the same pool of 500 instances and have mean Jaccard overlap around 0.35. The authors warn that dependence can make Wilcoxon p-values optimistic, and report Cliff’s delta and checks by nine difficulty levels. A small p-value alone should not decide the result.
Limitations and claim boundary: what remains unproven
The strongest results concern the estimation error of resolve rate on SWE repair benchmarks, not overall agent quality or detection recall for every class of new regression. Although the three scenarios vary a single agent, model/configuration, and framework, they still use SWE-Rebench and SWE-Bench Verified; the authors leave web navigation and other tool-use tasks for future work. A fixed subset selected from old runs may stop representing behavior after the coding agent changes.
The sanitizer classifier shows that explicit outcome tokens were reduced, but task text still contains signals that predict pass/fail; this does not establish that all leakage has disappeared. The 1,000 synthetic distributions come from overlapping samples of a 500-issue pool, limiting the independence assumption behind significance tests. Finally, average token cost for a 10% subset is about 10% of a full run, but per-instance costs vary by up to 492×, so a particular run can exceed its expected share. These limits mean the subset should be treated as a lower-cost estimator for the same benchmark, with periodic full runs and separate checks of task coverage.
Evidence map: paper, evidence, and engineering interpretation
| Layer | What this article says |
|---|---|
| Directly in the paper | Trajectory parsing, sanitization, embedding, outcome-stratified geometric selection, three evaluation scenarios, RMSE and MaxErr, 76 configurations, and ablation definitions/results. |
| Author interpretation | Outcome grouping preserves difficulty mix while trajectory geometry selects representative behavior within each group; their combination reduces estimation error and long-tail risk in the evaluated SWE regression setting. |
| Observed results | At 10%, Centroid Pooled median RMSE is 0.0431 on Multi-model and 0.0400 on Multi-agent; the cost study averages 10.48% of full tokens; removing outcome groups raises RMSE by 30–37%. |
| Bloss0m engineering synthesis | Treat the small subset as a frequent, lower-cost regression signal and schedule full runs at a slower cadence. Use an explicit error budget to decide which changes can advance early and which must wait for a full suite. The paper does not evaluate this CI policy. |
| Not established | Effectiveness outside code repair, sufficiency of 10% for arbitrary agents or benchmarks, universal superiority across configurations, recall of new failure types, or replacement of full evaluation. |
Bloss0m engineering judgment and when not to use it
Bloss0m engineering synthesis (a practical checklist, not a paper contribution): Before putting a similar method into CI, confirm three conditions. First, full-run outcomes, trajectories, and benchmark versions can be aligned across runs, and selection uses only data available at that point in time. Second, logs are cleaned for that specific benchmark by removing explicit outcome tokens, repository identity, and formatting boilerplate, then checking for leakage with a classifier or sample audit. Third, compare the subset with the full suite on a cadence, watching not only RMSE but also maximum deviation, uncovered task categories, and large regressions. Rebuild the subset when model/framework changes are large or error exceeds a team-defined limit. These are practical checks, not a complete production protocol tested by the paper.
The approach is most plausible when a team has historical full runs, can align stable benchmark instances, still cares about the same benchmark’s resolve rate, and cannot afford to run every issue on every change. Do not rely on the subset alone when an agent has moved to new tools or frameworks, the benchmark domain changed, too little history exists, outcome leakage cannot be checked, or the objective is to discover rare safety or quality failures rather than estimate average resolve rate. A subset can be an early signal alongside full runs, task-category coverage, targeted regression tests, and explicit rollback thresholds.
Artifacts and reproducibility (checked 2026-09-24)
The author-linked GitHub replication package is publicly browsable. On the date checked, the root README listed results/, four RQ reproduction scripts, shared analysis code, pipeline/, the reproduce.py entry point, and requirements. It describes producing most tables, figures, and numbers directly from the included results via python reproduce.py results, without downloading raw trajectories. This is an available analysis/results artifact, but the repository LICENSE says the replication package’s license has not yet been chosen; do not assume its code or data can be freely redistributed.
Running the full trajectory-to-result pipeline requires separately downloading vectors, repository maps, or raw trajectories. On 2026-09-24, the vectors dataset card showed three archive listings, MD5 manifests, and about 5.57 GB total. The card documents downloadable embedding files but does not state a clear reuse license for the vectors, and says raw trajectories remain subject to their source terms. Its multi-agent archive contains 3,499 vectors, one fewer than the 3,500 trajectories in the paper scenario because one trajectory has no steps and therefore no vector. The SWE-Rebench trajectory dataset page shows 67.1K rows, a CC BY 4.0 license, and a loading example; the SWE-bench experiments repository is also publicly browsable. I did not download the multi-gigabyte archives or rerun the end-to-end pipeline, so this verifies public listings and documentation, not a successful full reproduction. The README estimates hours for some runs and many additional hours for embedding. A public checkout does not include every input: vector fetching, source-specific access, and substantial recomputation remain dependencies.
Reuse of paper figures is a separate question. The arXiv v1 page lists the arXiv.org perpetual non-exclusive distribution license, not an explicit CC BY figure-reuse grant. The linked repository likewise has no selected license. I therefore do not reproduce original Figures 2, 4, or 6. The three diagrams in this article are independently drawn explanatory figures, linked to the corresponding paper anchors without tracing the original layout or presenting them as source figures. They are Bloss0m teaching illustrations, not new experimental evidence.
Further reading and three things to remember
For a related view of trajectory signals, see BTS AgentBench’s replayable telemetry. For the observability boundary in agent tools and multi-step behavior, compare Causal Failure Attribution in Agentic RAG. These papers have different objectives, but both show why an end score cannot replace careful definitions of process evidence and evaluation units.
- Technical idea: Historical pass-count groups control the subset’s difficulty mix; trajectory embeddings help select behaviorally representative instances only within each group. The two signals are not interchangeable.
- Evidence: The authors evaluate 76 configurations across 31,779 trajectories, 58 runs, and five frameworks, with later-run validation. At 10%, Centroid Pooled median RMSEs are 4.31% and 4.00% on Multi-model and Multi-agent; average token use falls by about 90%, but winners vary by scenario and subset size.
- Boundary: This is a 2026 arXiv v1 study of coding-agent regression on SWE-Bench Verified and SWE-Rebench. It does not establish that other agent tasks can be reduced to 10%, or that subset checks can replace full evaluation.
Primary sources
- Mahmoud Ayyad et al., Trajectory-Aware Benchmark Subset Selection for Cost-Efficient Software Engineering Agent Regression Testing, arXiv:2609.24928v1 (submitted 2026-09-21; preprint, not peer reviewed).
- arXiv abstract and license metadata (arXiv.org perpetual non-exclusive distribution license).
- Author-linked SWE-agent subset selection repository (README, results, reproduction scripts, pipeline; repository license not yet chosen).
- SWE-Rebench trajectory dataset; published embedding vectors; SWE-bench experiments.